


President Trump, after coming under fire for even considering the idea, on Thursday decided not to allow Russia to interrogate a former U.S. ambassador and other Americans, as Russia’s President Vladimir Putin proposed during their summit in Helsinki.
“It is a proposal that was made in sincerity by President Putin, but President Trump disagrees with it,” Press Secretary Sarah Huckabee Sanders said in a statement.
As Trump tried for a third straight day to answer critics, by taking a tougher line with Putin than he did when they met Monday, he also extended an olive branch — inviting Putin to Washington. Sanders said discussions are underway for a visit in the fall, just weeks before midterm elections.
Putin had floated the idea of the interrogations as part of a swap: He would allow 12 Russian operatives indicted last week in special counsel Robert S. Mueller III’s investigation of Moscow’s election interference to be questioned, but by Russian officials with U.S. investigators present — and only if the U.S. gave Russia access to a dozen Americans it accuses of crimes, including the former U.S. ambassador to Russia under President Obama, Michael McFaul.
In her statement, Sanders expressed hope that despite Trump’s belated rejection of Putin’s request, he “will have the 12 identified Russians come to the United States to prove their innocence or guilt.”
Trump, as he stood beside Putin at their summit, had labeled the Russian leader’s proposal an “incredible offer.” On Wednesday, Sanders confirmed that the president was considering the idea, provoking broad outrage across Washington.
Yet the State Department on Wednesday dismissed Russia’s allegations against McFaul and the others as “absurd.” Republicans as well as Democrats objected that Trump hadn’t immediately rejected Putin’s request, signaling that agreeing to such a proposal could be a red line for Congress.
“Under no circumstances should #Putin officials ever be allowed to come into the U.S. & ‘question’ Americans on their list,” Sen. Marco Rubio (R-Fla.) wrote in a tweet Thursday, hours before the White House announced Trump’s decision.
That decision came just after Trump met at the White House with Defense Secretary James N. Mattis and Secretary of State Michael R. Pompeo. Pompeo had strongly opposed the idea of allowing Russia access to the Americans, telling the Christian Broadcasting Network on Thursday, “That’s not going to happen.”
Even after the announcement, in a rebuke of the president, the Republican-controlled Senate voted 98-0 for a resolution opposing the “making available of current and former diplomats, officials, and members of the Armed Forces of the United States for questioning by the government of Vladimir Putin.”
Afterward, McFaul tweeted, “Bipartisanship is not dead yet in the US Senate. Thank you all for your support.”
The new dispute between Trump and Putin over the issue came as the two leaders otherwise offered remarkably similar takes on their summit, both insisting that it was a success and attacking American media and Trump investigators for standing in the way of U.S.-Russia cooperation.
Early Thursday, Trump tweeted that the summit “was a great success, except with the real enemy of the people, the Fake News Media.”
Trump claimed that the media “are pushing so recklessly hard and hate the fact that I’ll probably have a good relationship with Putin.” He went so far as to say that the media badly wants “a confrontation that could lead to war.”
Putin, in his first public comments about the summit, told Russian diplomats in a speech Thursday that relations with the United States had been “in some ways worse than during the Cold War” but their meeting put the two nations on “the path to positive change.”
“It is important that at last a full-scale meeting took place that allowed talking directly, and it was generally successful,” Putin said, according to Russian state news agencies.
However, there are “forces in the United States that are ready to sacrifice Russian-American relations for their ambitions in the domestic political struggle,” Putin added.
That seemed clearly an echo of Trump’s own complaints about the political cloud over his presidency: the special counsel’s investigation of Russia’s election interference and possible Trump campaign complicity.
Both leaders have claimed that their private, two-hour conversation yielded agreements in various policy areas, though by Thursday, the White House, State and Defense departments had been unable to provide details, with many officials professing to be in the dark themselves.
Even the director of national intelligence, former Sen. Dan Coats, acknowledged that he doesn’t know what took place between the two presidents, and said he opposed their meeting alone.
“That is the president’s prerogative,” Coats said. “I would have suggested a different way.”” He did not rule out the “risk” that the Russians recorded the conversation.
Coats, speaking at the Aspen Security Forum, also said that he “wished” Trump hadn’t initially accepted Putin’s denial of election interference. After the joint Trump-Putin news conference, Coats immediately issued an unusual statement of his own; at Aspen he said he wanted “to correct the record.”
He expressed some satisfaction with Trump’s subsequent statement on Tuesday that he accepted the intelligence community’s findings that Russia undermined the election campaign, but said he wished the president hadn’t added that “others” might have been involved as well.
Before news of Trump’s invitation to Putin, in a pair of tweets early Thursday he stated that he looks forward “to our second meeting so that we can start implementing some of the many things discussed.” He listed stopping terrorism, security for Israel, nuclear proliferation, cyberattacks, trade, Ukraine, Middle East peace and North Korea.
“They can ALL be solved!” he wrote.
Neither country has offered any specifics about particular agreements or future plans for bilateral collaboration. Some congressional Democrats have suggested subpoenaing the American translator — only the presidents’ respective interpreters were in the room for their initial meeting — to solve the mystery of what they discussed.
Republicans, who on the whole have been obsequious toward Trump, were quick to criticize him after he stood beside Putin and accepted the Russian’s denial of election interference over the unanimous conclusions of U.S. intelligence agencies.
While some Republicans eased up on Trump following his subsequent reversal and acceptance of his government’s intelligence findings, party leaders suggested they would consider additional sanctions on Russia amid ongoing concerns that it is attempting to interfere with the looming 2018 midterm elections.
Senate Majority Leader Mitch McConnell (R-Ky.) said Thursday that he has directed two Senate committees to offer recommendations for measures “that could respond to or deter Russian malign behavior.”
FBI Director Christopher Wray, also speaking at the Aspen conference, an annual gathering of national security experts in Colorado, reiterated his belief in the conclusions about Russian election interference and even hinted that he has considered resigning.
Department of Homeland Security Secretary Kirstjen Nielsen, speaking at the same conference, also acknowledged that she “agrees with” the U.S. intelligence findings.
But she dismissed the idea that Putin, who acknowledged Monday that he wanted Trump to beat Hillary Clinton in 2016, did so on her boss’ behalf — as the intelligence agencies have concluded.
“I haven’t seen any evidence that the attempt to interfere in our election infrastructure was to favor a particular political party,” Nielsen said.
While Cabinet officials are wary of angering Trump, Republicans appear to be walking a political tightrope, responding to a potential national security issue but careful not to upset the president or his most loyal supporters, whose turnout will be critical to Republicans’ chances in November.
A new CBS News poll Thursday showed that only about a third of Americans approve of Trump’s handling of relations with Russia, but 68% of Republicans approve, illustrating the bind that GOP elected officials are in.
Special correspondent Sabra Ayres in Moscow contributed to this report.


The Pronk Pops Show 1168, November 2, 2018, Story 1: Jobs Report — U.S. Economy Added 250,000 Jobs — Real Wages Up 3.1% and Capital Spending Growth — Civilian Labor Participation Rate Up .2% Going in Right Direction — Getting Better– All The Time — Videos — Story 2: Federal Reserve Will Be Increasing Fed Funds Target Rate by .25% In December 2018 — No Real Surprise — Videos — Story 3: President Trump’s Job Approval Rising — Hits 51% — Top Three Concerns of American People — The Economy, Illegal Immigration and Obamacare — Videos
Posted on November 4, 2018. Filed under: Addiction, American History, Banking System, Barack H. Obama, Bill Clinton, Blogroll, Books, Breaking News, Budgetary Policy, Business, College, Congress, Corruption, Countries, Deep State, Defense Spending, Donald J. Trump, Donald J. Trump, Donald J. Trump, Donald Trump, Eating, Economics, Education, Elections, Empires, Employment, Federal Government, First Amendment, Fiscal Policy, Foreign Policy, Former President Barack Obama, Free Trade, Freedom of Speech, Government, Government Dependency, Government Spending, Health, Health Care, Health Care Insurance, History, House of Representatives, Housing, Human, Human Behavior, Illegal Immigration, Immigration, Independence, Insurance, Investments, Labor Economics, Language, Law, Legal Immigration, Life, Lying, Media, Medicare, Monetary Policy, National Interest, Networking, News, Obama, Obesity, Overweight, People, Philosophy, Photos, Politics, Polls, President Trump, Progressives, Public Corruption, Public Relations, Radio, Raymond Thomas Pronk, Regulation, Rule of Law, Scandals, Security, Senate, Social Security, Spying, Success, Supplemental Nutrition Assistance Program (SNAP_, Surveillance and Spying On American People, Tax Policy, Taxation, Taxes, Terrorism, Trade Policy, Trump Surveillance/Spying, Unemployment, United States Constitution, United States of America, Videos, Violence, War, Wealth, Welfare Spending, Wisdom | Tags: 2 November 2018, 30-60 Million Illegal Alien Invasion of United States, America, Articles, Audio, Breaking News, Broadcasting, Bureau of Labor Statistics, Capitalism, Cartoons, Charity, Citizenship, Clarity, Classical Liberalism, Collectivism, Commentary, Commitment, Communicate, Communication, Concise, Convincing, Courage, Culture, Current Affairs, Current Events, Department of Labor, Deregulation, Economic Growth, Economic Policies Matter, Economic Policy, Economics, Education, Evil, Experience, Faith, Family, Fed Chairman, Financial Repression, First, Fiscal Policy, Free Enterprise, Freedom, Freedom of Speech, Friends, Give It A Listen!, God, Good, Goodwill, Growth, Hope, Illegal Immigration, Individualism, Jobs Report, Knowledge, Liberty, Life, Love, Lovers of Liberty, Milton Friedman, Monetary Policy, MPEG3, Myth of Fed Independence, News, Obamacare, Opinions, Peace, Photos, Podcasts, Political Philosophy, Politics, President Donald J. Trump, President Trump's Job Approval Hits 51%, Prosperity, Radio, Raymond Thomas Pronk, Representative Republic, Republic, Resources, Respect, Rule of Law, Rule of Men, Show Notes, Talk Radio, Tax Policy, The Economy, The Federal Reserve System, The Pronk Pops Show, The Pronk Pops Show 1168, Truth, Tyranny, U-3 Unemployment Rate, U-6 Unemployment Rate, U. S. Economy Adds 250000 Non-Farm Payrolls Jobs in October 2018, U.S. Constitution, United States of America, Videos, Virtue, War, Wisdom |
The Pronk Pops Show Podcasts
Pronk Pops Show 1168 November 2, 2018
Pronk Pops Show 1167 November 1, 2018
Pronk Pops Show 1166 October 31, 2018
Pronk Pops Show 1165 October 30, 2018
Pronk Pops Show 1164 October 29, 2018
Pronk Pops Show 1163 October 26, 2018
Pronk Pops Show 1162 October 24, 2018
Pronk Pops Show 1161 October 23, 2018
Pronk Pops Show 1160 October 22, 2018
Pronk Pops Show 1159 October 19, 2018
Pronk Pops Show 1158 October 18, 2018
Pronk Pops Show 1157 October 16, 2018
Pronk Pops Show 1156 October 15, 2018
Pronk Pops Show 1155 October 12, 2018
Pronk Pops Show 1154 October 11, 2018
Pronk Pops Show 1153 October 10, 2018
Pronk Pops Show 1152 October 5, 2018
Pronk Pops Show 1151 October 4, 2018
Pronk Pops Show 1150 October 3, 2018
Pronk Pops Show 1149, October 1, 2018
Pronk Pops Show 1148, September 28, 2018
Pronk Pops Show 1147, September 27, 2018
Pronk Pops Show 1146, September 25, 2018
Pronk Pops Show 1145, September 24, 2018
Pronk Pops Show 1144, September 20, 2018
Pronk Pops Show 1143, September 19, 2018
Pronk Pops Show 1142, September 18, 2018
Pronk Pops Show 1141, September 17, 2018
Pronk Pops Show 1140, September 14, 2018
Pronk Pops Show 1139, September 13, 2018
Pronk Pops Show 1138, September 12, 2018
Pronk Pops Show 1137, September 7, 2018
Pronk Pops Show 1136, September 6, 2018
Pronk Pops Show 1135, September 5, 2018
Pronk Pops Show 1134, September 4, 2018
Pronk Pops Show 1133, August 29, 2018
Pronk Pops Show 1132, August 28, 2018
Pronk Pops Show 1131, August 27, 2018
Pronk Pops Show 1130, August 22, 2018
Pronk Pops Show 1129, August 21, 2018
Pronk Pops Show 1128, August 20, 2018
Pronk Pops Show 1127, August 17, 2018
Pronk Pops Show 1126, August 16, 2018
Pronk Pops Show 1125, August 15, 2018
Pronk Pops Show 1124, August 14, 2018
Pronk Pops Show 1123, August 13, 2018
Pronk Pops Show 1122, August 9, 2018
Pronk Pops Show 1121, August 8, 2018
Pronk Pops Show 1120, August 6, 2018
Pronk Pops Show 1119, August 2, 2018
Pronk Pops Show 1118, August 1, 2018
Story 1: November 2018 Jobs Report — U.S. Economy Added 250,000 Jobs With 3.7% U-3 Unemployment Rate — Real Wages Up 3.1% and Capital Spending Growth — Civilian Labor Participation Rate Up .2% Going in Right Direction Up! — Getting Better– All The Time — Videos
The Beatles – Getting Better
The teachers who taught me weren’t cool (No, I can’t complain)
You’re holding me down
Turning me round
Filling me up with your rules
A little better all the time (It can’t get no worse)
I have to admit it’s getting better (Better)
It’s getting better
Since you’ve been mine
Me hiding me head in the sand
You gave me the word, I finally heard
I’m doing the best that I can
A little better all the time (It can’t get no worse)
I have to admit it’s getting better (Better)
It’s getting better
Since you’ve been mine
Better, better, better
It’s getting better all the time
Better, better, better
I beat her and kept her apart from the things that she loved
Man, I was mean but I’m changing my scene
And I’m doing the best that I can (ooh)
A little better all the time (It can’t get no worse)
Yes, I admit it’s getting better (Better)
It’s getting better
Since you’ve been mine
Better, better, better
It’s getting better all the time
Better, better, better
Trump celebrates strong jobs report at rally
Job growth powers ahead
Economy adds 250K jobs in October
Santelli Exchange: Lazear on the jobs report
Jim Cramer on October jobs report: We have to move fast
CEA’s Hassett on China Trade, Jobs Report, Debt and Deficit
What does October’s banner jobs report tell us about where the economy is headed?
A Deep Dive Into the U.S. October Jobs Report
How Wall Street Views the October Jobs Report
What the markets want from the jobs report
What Is 3%? Jim Cramer on the Jobs Report
Alan Greenspan: Tightest labor market I’ve ever seen
Greenspan: We are in uncharted territory
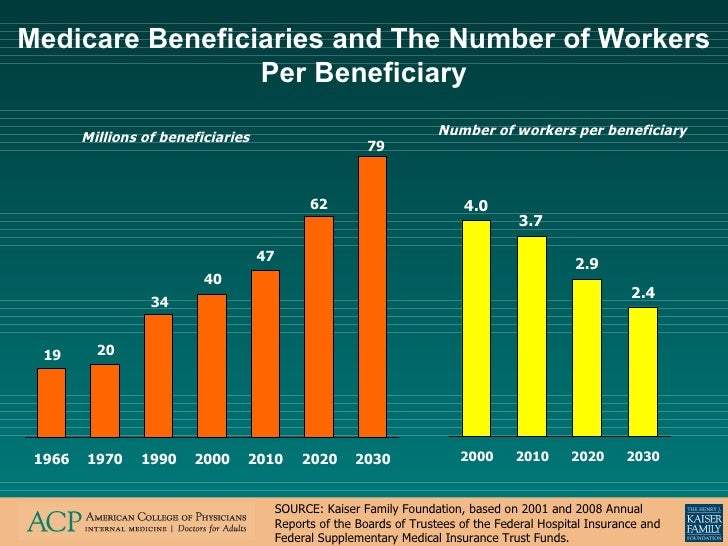
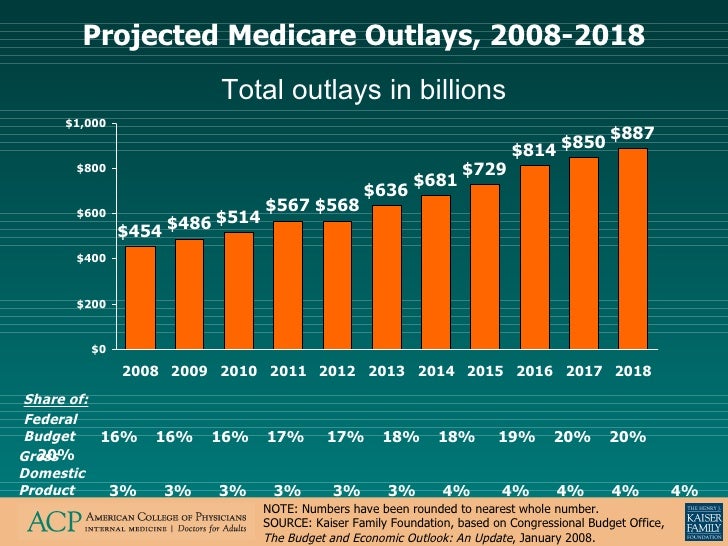
Alan Greenspan: We have to deal with entitlements
Greenspan: The financial community doesn’t care about bookkeeping, they’re going to confront inflation
Defining the Unemployment Rate
Is Unemployment Undercounted?
Labor Force Participation
Cyclical Unemployment
Frictional Unemployment
Structural Unemployment
Monetary Policy and the Federal Reserve
Monetary Policy: The Best Case Scenario
Milton Friedman: Inflation vs Unemployment
Milton Friedman – Stimulus and Inflation
Milton Friedman – Money and Inflation (Q&A)
Responsibility to the Poor
Milton Friedman: There’s No Such Thing as a Free Lunch
TAKE IT TO THE LIMITS: Milton Friedman on Libertarianism
156,562,000: Record Employment for 12th Time Under Trump
(CNSNews.com) – The economy is the second most important issue for registered voters as the midterm election nears, a new Gallup Poll says. And there was very good economic news on Friday, as the Labor Department’s Bureau of Labor Statistics rolled out the October employment report — the final one before next week’s midterm election.
The number of employed Americans has never been higher. The 156,562,000 Americans employed in October is the twefth record set under President Donald Trump.
In October, the number of employed men age 20 and up — 80,405,000 — set the 12th record since Trump took office; and likewise, for the 12th time, the number of employed women age 20 and up set a record, reaching 70,909,000 in October.
The unemployment rate held at 3.7 percent, the same as September, which is the lowest it’s been in decades — since the end of 1969. And the Hispanic unemployment rate, 4.4 percent, has never been lower.
The unemployment rate for African-Americans, 6.2 percent, remained near the all-time low of 5.9 percent set in May.
On top of those numbers, the economy added a whopping 250,000 jobs last month. After revisions, job gains have averaged 218,000 over the past 3 months.
(“Wow!” Trump tweeted on Friday morning. “The U.S. added 250,000 Jobs in October – and this was despite the hurricanes. Unemployment at 3.7%. Wages UP! These are incredible numbers. Keep it going, Vote Republican!”)
The number of Americans not in the labor force dipped to 95.8 million, down from last month’s record high; and the labor force participation rate increased two-tenths of a point to 62.9 percent, a move in the right direction.
Among the major worker groups, the unemployment rates for adult men (3.5 percent), adult women (3.4 percent), teenagers (11.9 percent), Whites (3.3 percent), Blacks (6.2 percent), and Asians (3.2 percent) showed little or no change in October.
In October, average hourly earnings for all employees on private nonfarm payrolls rose by 5 cents to $27.30. Over the year, average hourly earnings have increased by 83 cents, or 3.1 percent.
In October, the nation’s civilian noninstitutionalized population, consisting of all people age 16 or older who were not in the military or an institution, reached 258,514,000. Of those, 162,637,000 participated in the labor force by either holding a job or actively seeking one.
The 162,637,000 who participated in the labor force equaled 62.9 percent of the 258,514,000 civilian noninstitutionalized population, the same as August.
The higher the participation rate, the better, but economists expect this percentage to remain stagnant and decline in the years ahead as an increasing number of baby boomers retire.
President Trump highlghted the booming economy at his rally in Missouri yesterday, telling voters that next week’s election “will decide whether we build on an extraordinary prosperity,” or whether Democrats “will wipe it all away.”
“The unemployment rate just fell to the lowest level in over 50 years,” the president said. “More Americans are working now than any time in history. Think of that…So today, right now, we have more Americans working than at any time, any time in the history of our country. That’s pretty good,” he said. “That’s pretty good!”
https://pronkpops.wordpress.com/wp-admin/post-new.php
Alternate Unemployment Charts
The seasonally-adjusted SGS Alternate Unemployment Rate reflects current unemployment reporting methodology adjusted for SGS-estimated long-term discouraged workers, who were defined out of official existence in 1994. That estimate is added to the BLS estimate of U-6 unemployment, which includes short-term discouraged workers.
The U-3 unemployment rate is the monthly headline number. The U-6 unemployment rate is the Bureau of Labor Statistics’ (BLS) broadest unemployment measure, including short-term discouraged and other marginally-attached workers as well as those forced to work part-time because they cannot find full-time employment.
Public Commentary on Unemployment
Unemployment Data Series (Subscription required.) View Download Excel CSV File Last Updated: November 2nd, 2018
The ShadowStats Alternate Unemployment Rate for October 2018 is 21.2%.
Republishing our charts: Permission, Restrictions and Instructions (includes important requirements for successful hot-linking)
http://www.shadowstats.com/alternate_data/unemployment-charts
Labor Force Statistics from the Current Population Survey
Civilian Labor Force Level
162,637,000
Labor Force Participation Rate
62.9%
Unemployment Level
6,075,000
Not in Labor Force
95,877,000
U-3 Unemployment Rate
3.7%
U-6 Unemployment Rate
7.4 %
Employment Situation Summary
Transmission of material in this news release is embargoed until USDL-18-1739 8:30 a.m. (EDT) Friday, November 2, 2018 Technical information: Household data: (202) 691-6378 * cpsinfo@bls.gov * www.bls.gov/cps Establishment data: (202) 691-6555 * cesinfo@bls.gov * www.bls.gov/ces Media contact: (202) 691-5902 * PressOffice@bls.gov THE EMPLOYMENT SITUATION -- OCTOBER 2018 Total nonfarm payroll employment rose by 250,000 in October, and the unemployment rate was unchanged at 3.7 percent, the U.S. Bureau of Labor Statistics reported today. Job gains occurred in health care, in manufacturing, in construction, and in transportation and warehousing. __________________________________________________________________________________ | | | Hurricane Michael | | | | Hurricane Michael made landfall in the Florida Panhandle on October 10, 2018, | | during the reference periods for both the establishment and household surveys. | | Hurricane Michael had no discernible effect on the national employment and | | unemployment estimates for October, and response rates for the two surveys were | | within normal ranges. For information on how severe weather can affect employment| | and hours data, see Question 8 in the Frequently Asked Questions section of this | | news release. | | | | BLS will release the state estimates of employment and unemployment on | | November 16, 2018, at 10:00 a.m. (EST). | |__________________________________________________________________________________| Household Survey Data The unemployment rate remained at 3.7 percent in October, and the number of unemployed persons was little changed at 6.1 million. Over the year, the unemployment rate and the number of unemployed persons declined by 0.4 percentage point and 449,000, respectively. (See table A-1.) Among the major worker groups, the unemployment rates for adult men (3.5 percent), adult women (3.4 percent), teenagers (11.9 percent), Whites (3.3 percent), Blacks (6.2 percent), Asians (3.2 percent), and Hispanics (4.4 percent) showed little or no change in October. (See tables A-1, A-2, and A-3.) The number of long-term unemployed (those jobless for 27 weeks or more) was essentially unchanged at 1.4 million in October and accounted for 22.5 percent of the unemployed. (See table A-12.) The labor force participation rate increased by 0.2 percentage point to 62.9 percent in October but has shown little change over the year. The employment-population ratio edged up by 0.2 percentage point to 60.6 percent in October and has increased by 0.4 percentage point over the year. (See table A-1.) The number of persons employed part time for economic reasons (sometimes referred to as involuntary part-time workers) was essentially unchanged at 4.6 million in October. These individuals, who would have preferred full-time employment, were working part time because their hours had been reduced or they were unable to find full-time jobs. (See table A-8.) In October, 1.5 million persons were marginally attached to the labor force, little changed from a year earlier. (Data are not seasonally adjusted.) These individuals were not in the labor force, wanted and were available for work, and had looked for a job sometime in the prior 12 months. They were not counted as unemployed because they had not searched for work in the 4 weeks preceding the survey. (See table A-16.) Among the marginally attached, there were 506,000 discouraged workers in October, about unchanged from a year earlier. (Data are not seasonally adjusted.) Discouraged workers are persons not currently looking for work because they believe no jobs are available for them. The remaining 984,000 persons marginally attached to the labor force in October had not searched for work for reasons such as school attendance or family responsibilities. (See table A-16.) Establishment Survey Data Total nonfarm payroll employment increased by 250,000 in October, following an average monthly gain of 211,000 over the prior 12 months. In October, job growth occurred in health care, in manufacturing, in construction, and in transportation and warehousing. (See table B-1.) Health care added 36,000 jobs in October. Within the industry, employment growth occurred in hospitals (+13,000) and in nursing and residential care facilities (+8,000). Employment in ambulatory health care services continued to trend up (+14,000). Over the past 12 months, health care employment grew by 323,000. In October, employment in manufacturing increased by 32,000. Most of the increase occurred in durable goods manufacturing, with a gain in transportation equipment (+10,000). Manufacturing has added 296,000 jobs over the year, largely in durable goods industries. Construction employment rose by 30,000 in October, with nearly half of the gain occurring among residential specialty trade contractors (+14,000). Over the year, construction has added 330,000 jobs. Transportation and warehousing added 25,000 jobs in October. Within the industry, employment growth occurred in couriers and messengers (+8,000) and in warehousing and storage (+8,000). Over the year, employment in transportation and warehousing has increased by 184,000. Employment in leisure and hospitality edged up in October (+42,000). Employment was unchanged in September, likely reflecting the impact of Hurricane Florence. The average gain for the 2 months combined (+21,000) was the same as the average monthly gain in the industry for the 12-month period prior to September. In October, employment in professional and business services continued to trend up (+35,000). Over the year, the industry has added 516,000 jobs. Employment in mining also continued to trend up over the month (+5,000). The industry has added 65,000 jobs over the year, with most of the gain in support activities for mining. Employment in other major industries--including wholesale trade, retail trade, information, financial activities, and government--showed little change over the month. The average workweek for all employees on private nonfarm payrolls increased by 0.1 hour to 34.5 hours in October. In manufacturing, the workweek edged down by 0.1 hour to 40.8 hours, and overtime was unchanged at 3.5 hours. The average workweek for production and nonsupervisory employees on private nonfarm payrolls, at 33.7 hours, was unchanged over the month. (See tables B-2 and B-7.) In October, average hourly earnings for all employees on private nonfarm payrolls rose by 5 cents to $27.30. Over the year, average hourly earnings have increased by 83 cents, or 3.1 percent. Average hourly earnings of private-sector production and nonsupervisory employees increased by 7 cents to $22.89 in October. (See tables B-3 and B-8.) The change in total nonfarm payroll employment for September was revised down from +134,000 to +118,000, and the change for August was revised up from +270,000 to +286,000. The downward revision in September offset the upward revision in August. (Monthly revisions result from additional reports received from businesses and government agencies since the last published estimates and from the recalculation of seasonal factors.) After revisions, job gains have averaged 218,000 over the past 3 months. _____________ The Employment Situation for November is scheduled to be released on Friday, December 7, 2018, at 8:30 a.m. (EST).The PDF version of the news release
News release charts
Supplemental Files Table of Contents
Table of Contents
Employment Situation Summary Table A. Household data, seasonally adjusted
Summary table A. Household data, seasonally adjusted[Numbers in thousands]
2017
2018
2018
2018
Sept.
2018-
Oct.
2018
Employment status
Civilian noninstitutional population
Civilian labor force
Participation rate
Employed
Employment-population ratio
Unemployed
Unemployment rate
Not in labor force
Unemployment rates
Total, 16 years and over
Adult men (20 years and over)
Adult women (20 years and over)
Teenagers (16 to 19 years)
White
Black or African American
Asian
Hispanic or Latino ethnicity
Total, 25 years and over
Less than a high school diploma
High school graduates, no college
Some college or associate degree
Bachelor’s degree and higher
Reason for unemployment
Job losers and persons who completed temporary jobs
Job leavers
Reentrants
New entrants
Duration of unemployment
Less than 5 weeks
5 to 14 weeks
15 to 26 weeks
27 weeks and over
Employed persons at work part time
Part time for economic reasons
Slack work or business conditions
Could only find part-time work
Part time for noneconomic reasons
Persons not in the labor force (not seasonally adjusted)
Marginally attached to the labor force
Discouraged workers
– Over-the-month changes are not displayed for not seasonally adjusted data.
NOTE: Persons whose ethnicity is identified as Hispanic or Latino may be of any race. Detail for the seasonally adjusted data shown in this table will not necessarily add to totals because of the independent seasonal adjustment of the various series. Updated population controls are introduced annually with the release of January data.
Employment Situation Summary Table B. Establishment data, seasonally adjusted
Summary table B. Establishment data, seasonally adjusted
2017
2018
2018(P)
2018(P)
EMPLOYMENT BY SELECTED INDUSTRY
(Over-the-month change, in thousands)
Total nonfarm
Total private
Goods-producing
Mining and logging
Construction
Manufacturing
Durable goods(1)
Motor vehicles and parts
Nondurable goods
Private service-providing
Wholesale trade
Retail trade
Transportation and warehousing
Utilities
Information
Financial activities
Professional and business services(1)
Temporary help services
Education and health services(1)
Health care and social assistance
Leisure and hospitality
Other services
Government
(3-month average change, in thousands)
Total nonfarm
Total private
WOMEN AND PRODUCTION AND NONSUPERVISORY EMPLOYEES
AS A PERCENT OF ALL EMPLOYEES(2)
Total nonfarm women employees
Total private women employees
Total private production and nonsupervisory employees
HOURS AND EARNINGS
ALL EMPLOYEES
Total private
Average weekly hours
Average hourly earnings
Average weekly earnings
Index of aggregate weekly hours (2007=100)(3)
Over-the-month percent change
Index of aggregate weekly payrolls (2007=100)(4)
Over-the-month percent change
DIFFUSION INDEX
(Over 1-month span)(5)
Total private (258 industries)
Manufacturing (76 industries)
Footnotes
(1) Includes other industries, not shown separately.
(2) Data relate to production employees in mining and logging and manufacturing, construction employees in construction, and nonsupervisory employees in the service-providing industries.
(3) The indexes of aggregate weekly hours are calculated by dividing the current month’s estimates of aggregate hours by the corresponding annual average aggregate hours.
(4) The indexes of aggregate weekly payrolls are calculated by dividing the current month’s estimates of aggregate weekly payrolls by the corresponding annual average aggregate weekly payrolls.
(5) Figures are the percent of industries with employment increasing plus one-half of the industries with unchanged employment, where 50 percent indicates an equal balance between industries with increasing and decreasing employment.
(P) Preliminary
NOTE: Data have been revised to reflect March 2017 benchmark levels and updated seasonal adjustment factors.
The Beatles – Hey Jude
Take a sad song and make it better
Remember to let her into your heart
Then you can start to make it better
You were made to go out and get her
The minute you let her under your skin
Then you begin to make it better
Don’t carry the world upon your shoulders
For well you know that it’s a fool who plays it cool
By making his world a little colder
Nah nah nah nah nah nah nah nah nah
You have found her, now go and get her
Remember to let her into your heart
Then you can start to make it better
You’re waiting for someone to perform with
And don’t you know that it’s just you, hey Jude, you’ll do
The movement you need is on your shoulder
Nah nah nah nah nah nah nah nah nah yeah
Take a sad song and make it better
Remember to let her under your skin
Then you’ll begin to make it
Better better better better better better, oh
Nah nah nah nah nah nah, nah nah nah, hey Jude
Nah nah nah nah nah nah, nah nah nah, hey Jude
Nah nah nah nah nah nah, nah nah nah, hey Jude
Nah nah nah nah nah nah, nah nah nah, hey Jude
Nah nah nah nah nah nah, nah nah nah, hey Jude
Nah nah nah nah nah nah, nah nah nah, hey Jude
Nah nah nah nah nah nah, nah nah nah, hey Jude
Nah nah nah nah nah nah, nah nah nah, hey Jude
Nah nah nah nah nah nah, nah nah nah, hey Jude
Nah nah nah nah nah nah, nah nah nah, hey Jude
Nah nah nah nah nah nah, nah nah nah, hey Jude
Nah nah nah nah nah nah, nah nah nah, hey Jude
Nah nah nah nah nah nah, nah nah nah, hey Jude
Nah nah nah nah nah nah, nah nah nah, hey Jude
Nah nah nah nah nah nah, nah nah nah, hey Jude
Getting Better
Jump to navigationJump to search
“Getting Better” is a song written mainly by Paul McCartney, with lyrical contributions from John Lennon (credited to Lennon–McCartney).[3] It was recorded by the Beatles for the 1967 album Sgt. Pepper’s Lonely Hearts Club Band.
Composition
The song, which has been said to be musically reminiscent of the hit single “Penny Lane,”[4] moves forward by way of regular chords, produced by Lennon’s guitar, McCartney’s electric piano,[verification needed] and George Martin, who struck the strings of a pianet with a mallet. These heavily accented and repetitive lines cause the song to sound as if it is based on a drone. Lead guitarist George Harrison adds an Indian tanpura part to the final verse, which further accentuates this impact.
McCartney’s bassline, in counterpoint to this droning, was described by music critic Ian MacDonald as “dreamy” and “well thought out as a part of the production by McCartney”.[5] It was recorded after the main track was completed, as were many of the bass lines on Sgt Pepper’s Lonely Hearts Club Band.[6] Starting out in the verse with a pedal on the root note (G) that leaps two octaves, McCartney moves to a marching quarter-note (walking) bass line for the first (and only the first) chorus. In stark contrast, all subsequent choruses are played using a fluid, swing feel, full of anticipated notes that propel the song forward despite the quarter-note droning of the guitar and keyboard.
The song’s title and music suggest optimism, but some of the song’s lyrics have a more negative tone. In this sense, it reflects the contrasting personas of the two songwriters. In response to McCartney’s line, “It’s getting better all the time”, Lennon replies, “Can’t get no worse!”[7] In a December 1983 interview, McCartney praised this contribution as an example of things he “couldn’t ever have done [him]self”.[8]
Referring to the lyric “I used to be cruel to my woman/I beat her and kept her apart from the things that she loved/Man I was mean but I’m changing my scene/And I’m doing the best that I can”, Lennon admitted that he had done things in relationships in the past that he was not proud of.[9]
In a 1980 interview in Playboy with John Lennon and Yoko Ono, Lennon, when asked about the song, said that the song’s lyrics came personally from his own experience abusing women in relationships in the past. He states: “It is a diary form of writing. All that ‘I used to be cruel to my woman / I beat her and kept her apart from the things that she loved’ was me. I used to be cruel to my woman, and physically—any woman. I was a hitter. I couldn’t express myself and I hit. I fought men and I hit women. That is why I am always on about peace, you see. It is the most violent people who go for love and peace. Everything’s the opposite. But I sincerely believe in love and peace. I am a violent man who has learned not to be violent and regrets his violence. I will have to be a lot older before I can face in public how I treated women as a youngster.”
According to the author Hunter Davies and music critic Ian MacDonald, the initial idea for the song’s title came from a phrase often spoken by Jimmie Nicol, the group’s stand-in drummer for the Australian leg of a 1964 tour.[3][5]
Lennon on the roof
One of the recording sessions for “Getting Better” is infamous for an incident involving Lennon. During the 21 March 1967 session in which producer George Martin added a piano solo to “Lovely Rita“, Lennon complained that he did not feel well and could not focus.[10][11]He had accidentally taken LSD when he meant to take an upper.[12] Unaware of the mistake, Martin took him up to the roof of Abbey Road Studios for some fresh air, and returned to Studio Two where McCartney and Harrison were waiting. They knew why Lennon was not well, and upon hearing where Lennon was, rushed to the roof to retrieve him and prevent a possible accident.[11][13][14]
Personnel
Live performances
Paul McCartney performed the song live for the first time by any Beatle on his 2002 Driving World Tour. He later reprised the song on his 2003 Back in the World Tour.[citation needed]
Cover versions
Notes
References
External links
https://en.wikipedia.org/wiki/Getting_Better
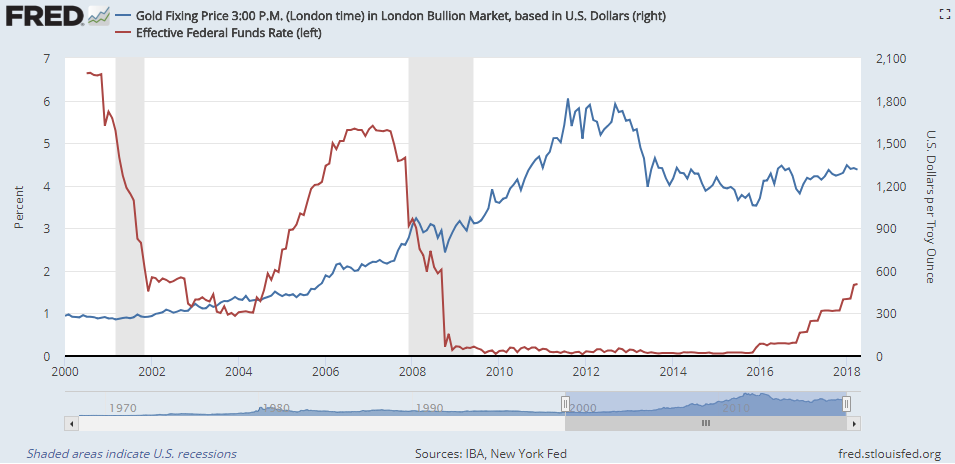
Story 2: Federal Reserve Will Be Increasing Fed Funds Target Rate by .25% In December 2018 — No Real Surprise — Videos
US Federal Reserve chairman Powell: Economy ‘looks very good’
We’re raising interest rates too often: Puzder
Fed Should Hold Off on a December Rate Hike, Furman Says
What If the Fed Is Getting It Right?
Fed: Gradual rate increase consistent with expansion
Peter Schiff: The markets are going to collapse due to Fed raising rates
Jim Cramer on October jobs report: We have to move fast
Gary Shilling Warns Fed Tightening Could Trigger A Recession
What Is the Federal Funds Rate?
The Federal Fund Rate in 4 Minutes
What’s all the Yellen About? Monetary Policy and the Federal Reserve: Crash Course Economics #10
Is the October sell-off overdone?
Chart master says it’s about to get worse before it gets better
Trump says the Federal Reserve is ‘out of control’
Roubini Warns of ‘Perfect Storm’ for U.S. Economy in 2020
Steve Keen Says U.S. Heading for 2020 Recession
Alan Greenspan on U.S. Debt, Deficit, Tax Cuts
Alan Greenspan on Federal Budget Deficit, Asset Valuations
Milton Friedman – What is Monetary Policy?
Milton Friedman on Money / Monetary Policy (Federal Reserve) Part 1
Milton Friedman on Money / Monetary Policy (Federal Reserve) Part 2
Milton Friedman – Monetary Revolutions
Story 3: President Trump’s Job Approval Rising — Hits 51% — Top Three Concerns of American People — The Economy, Illegal Immigration and Obamacare — Videos
Daily Presidential Tracking Poll
The Rasmussen Reports daily Presidential Tracking Poll for Friday shows that 51% of Likely U.S. Voters approve of President Trump’s job performance. Forty-seven percent (47%) disapprove.
The latest figures include 37% who Strongly Approve of the president is performing and 40% who Strongly Disapprove. This gives him a Presidential Approval Index rating of -3. (See trends)
Regular updates are posted Monday through Friday at 9:30 a.m. Eastern (sign up for free daily email update).
Now that Gallup has quit the field, Rasmussen Reports is the only nationally recognized public opinion firm that still tracks President Trump’s job approval ratings on a daily basis. If your organization is interested in a weekly or longer sponsorship of Rasmussen Reports’ Daily Presidential Tracking Poll, please send e-mail to beth@rasmussenreports.com .
With early voting in full swing and Election Day approaching, we asked voters if they’re more likely or less likely to tell people how they are voting. Trump voters held back in 2016, and that unmeasured margin fooled most pollsters, not Rasmussen Reports. Find out at 10:30 if that silent vote is still out there.
Seventy-seven percent (77%) of Republicans say they always vote in midterm elections, as do 71% of Democrats and 63% of voters not affiliated with either major political party. The real story on Tuesday will be which side turns out even more than usual.
Look for Rasmussen Reports’ final Generic Congressional Ballot on Monday morning. Democrats now hold a three-point lead on the survey which has a +/- 2 margin of error.
President Trump is sending troops to the southern border to stop thousands of Central Americans now in Mexico from entering the United States illegally. Voters tend to agree with the president’s decision, but as is frequently the case on issues related to illegal immigration, there’s a sharp difference of opinion between Democrats and Republicans.
Illegal immigration is the most important voting issue in the upcoming elections for 22% of Republicans, 15% of unaffiliated voters and eight percent (8%) of Democrats.
Sixty-one percent (61%) of Americans favor the death penalty, and among these adults, 68% think it needs to be carried out in a more timely fashion rather than delayed for all possible legal appeals.
Following last weekend’s massacre at a synagogue in Pittsburgh, Americans continue to worry that media overcoverage of horrific events like this inspires copycats.
Democrats (51%) are much more likely than Republicans (13%) and those not affiliated with either major party (25%) to blame the availability of guns for mass shootings more than the person who pulls the trigger.
Some readers wonder how we come up with our job approval ratings for the president since they often don’t show as dramatic a change as some other pollsters do. It depends on how you ask the question and whom you ask.
To get a sense of longer-term job approval trends for the president, Rasmussen Reports compiles our tracking data on a full month-by-month basis.
Rasmussen Reports has been a pioneer in the use of automated telephone polling techniques, but many other firms still utilize their own operator-assisted technology (see methodology).
Daily tracking results are collected via telephone surveys of 500 likely voters per night and reported on a three-day rolling average basis. To reach those who have abandoned traditional landline telephones, Rasmussen Reports uses an online survey tool to interview randomly selected participants from a demographically diverse panel. The margin of sampling error for the full sample of 1,500 Likely Voters is +/- 2.5 percentage points with a 95% level of confidence. Results are also compiled on a full-week basis and crosstabs for full-week results are available for Platinum Members.
Rasmussen Reports is a media company specializing in the collection, publication and distribution of public opinion information.
We conduct public opinion polls on a variety of topics to inform our audience on events in the news and other topics of interest. To ensure editorial control and independence, we pay for the polls ourselves and generate revenue through the sale of subscriptions, sponsorships, and advertising. Nightly polling on politics, business and lifestyle topics provides the content to update the Rasmussen Reports web site many times each day. If it’s in the news, it’s in our polls. Additionally, the data drives a daily update newsletter and various media outlets across the country.
Some information, including the Rasmussen Reports daily Presidential Tracking Poll and commentariesare available for free to the general public. Subscriptions are available for $4.95 a month or 34.95 a year that provide subscribers with exclusive access to more than 20 stories per week on upcoming elections, consumer confidence, and issues that affect us all. For those who are really into the numbers, Platinum Members can review demographic crosstabs and a full history of our data.
http://www.rasmussenreports.com/public_content/politics/political_updates/prez_track_nov02
Trump, Economy Top Voter Concerns
Thursday, October 25, 2018
President Trump and the economy are the major concerns for voters going into the midterm congressional elections.
The latest Rasmussen Reports national telephone and online survey finds that 30% of Likely U.S. Voters view Trump as the most important issue to their vote in the upcoming elections. The economy is most important for 22%, followed by 15% who rank illegal immigration that way and 14% who say the same of Obamacare. (To see survey question wording, click here.)
Rasmussen Reports invites you to be a part of our first-ever Citizen-Sourced National Midterm Election Polling Project. Learn more about how you can contribute.
(Want a free daily email update? If it’s in the news, it’s in our polls). Rasmussen Reports updates are also available on Twitter or Facebook.
The survey of 1,000 Likely Voters was conducted on October 23-24, 2018 by Rasmussen Reports. The margin of sampling error is +/- 3 percentage points with a 95% level of confidence. Field work for all Rasmussen Reports surveys is conducted by Pulse Opinion Research, LLC. See methodology.
http://www.rasmussenreports.com/public_content/politics/general_politics/october_2018/trump_economy_top_voter_concerns
The Pronk Pops Show Podcasts Portfolio
Listen To Pronk Pops Podcast or Download Shows 1169
Listen To Pronk Pops Podcast or Download Shows 1159-1168
Listen To Pronk Pops Podcast or Download Shows 1151-1158
Listen To Pronk Pops Podcast or Download Shows 1145-1150
Listen To Pronk Pops Podcast or Download Shows 1139-1144
Listen To Pronk Pops Podcast or Download Shows 1131-1138
Listen To Pronk Pops Podcast or Download Shows 1122-1130
Listen To Pronk Pops Podcast or Download Shows 1112-1121
Listen To Pronk Pops Podcast or Download Shows 1101-1111
Listen To Pronk Pops Podcast or Download Shows 1091-1100
Listen To Pronk Pops Podcast or Download Shows 1082-1090
Listen To Pronk Pops Podcast or Download Shows 1073-1081
Listen To Pronk Pops Podcast or Download Shows 1066-1073
Listen To Pronk Pops Podcast or Download Shows 1058-1065
Listen To Pronk Pops Podcast or Download Shows 1048-1057
Listen To Pronk Pops Podcast or Download Shows 1041-1047
Listen To Pronk Pops Podcast or Download Shows 1033-1040
Listen To Pronk Pops Podcast or Download Shows 1023-1032
Listen To Pronk Pops Podcast or Download Shows 1017-1022
Listen To Pronk Pops Podcast or Download Shows 1010-1016
Listen To Pronk Pops Podcast or Download Shows 1001-1009
Listen To Pronk Pops Podcast or Download Shows 993-1000
Listen To Pronk Pops Podcast or Download Shows 984-992
Listen To Pronk Pops Podcast or Download Shows 977-983
Listen To Pronk Pops Podcast or Download Shows 970-976
Listen To Pronk Pops Podcast or Download Shows 963-969
Listen To Pronk Pops Podcast or Download Shows 955-962
Listen To Pronk Pops Podcast or Download Shows 946-954
Listen To Pronk Pops Podcast or Download Shows 938-945
Listen To Pronk Pops Podcast or Download Shows 926-937
Listen To Pronk Pops Podcast or Download Shows 916-925
Listen To Pronk Pops Podcast or Download Shows 906-915
Listen To Pronk Pops Podcast or Download Shows 889-896
Listen To Pronk Pops Podcast or Download Shows 884-888
Listen To Pronk Pops Podcast or Download Shows 878-883
Listen To Pronk Pops Podcast or Download Shows 870-877
Listen To Pronk Pops Podcast or Download Shows 864-869
Listen To Pronk Pops Podcast or Download Shows 857-863
Listen To Pronk Pops Podcast or Download Shows 850-856
Listen To Pronk Pops Podcast or Download Shows 845-849
Listen To Pronk Pops Podcast or Download Shows 840-844
Listen To Pronk Pops Podcast or Download Shows 833-839
Listen To Pronk Pops Podcast or Download Shows 827-832
Listen To Pronk Pops Podcast or Download Shows 821-826
Listen To Pronk Pops Podcast or Download Shows 815-820
Listen To Pronk Pops Podcast or Download Shows 806-814
Listen To Pronk Pops Podcast or Download Shows 800-805
Listen To Pronk Pops Podcast or Download Shows 793-799
Listen To Pronk Pops Podcast or Download Shows 785-792
Listen To Pronk Pops Podcast or Download Shows 777-784
Listen To Pronk Pops Podcast or Download Shows 769-776
Listen To Pronk Pops Podcast or Download Shows 759-768
Listen To Pronk Pops Podcast or Download Shows 751-758
Listen To Pronk Pops Podcast or Download Shows 745-750
Listen To Pronk Pops Podcast or Download Shows 738-744
Listen To Pronk Pops Podcast or Download Shows 732-737
Listen To Pronk Pops Podcast or Download Shows 727-731
Listen To Pronk Pops Podcast or Download Shows 720-726
Listen To Pronk Pops Podcast or Download Shows 713-719
Listen To Pronk Pops Podcast or Download Shows 705-712
Listen To Pronk Pops Podcast or Download Shows 695-704
Listen To Pronk Pops Podcast or Download Shows 685-694
Listen To Pronk Pops Podcast or Download Shows 675-684
Listen To Pronk Pops Podcast or Download Shows 668-674
Listen To Pronk Pops Podcast or Download Shows 660-667
Listen To Pronk Pops Podcast or Download Shows 651-659
Listen To Pronk Pops Podcast or Download Shows 644-650
Listen To Pronk Pops Podcast or Download Shows 637-643
Listen To Pronk Pops Podcast or Download Shows 629-636
Listen To Pronk Pops Podcast or Download Shows 617-628
Listen To Pronk Pops Podcast or Download Shows 608-616
Listen To Pronk Pops Podcast or Download Shows 599-607
Listen To Pronk Pops Podcast or Download Shows 590-598
Listen To Pronk Pops Podcast or Download Shows 585- 589
Listen To Pronk Pops Podcast or Download Shows 575-584
Listen To Pronk Pops Podcast or Download Shows 565-574
Listen To Pronk Pops Podcast or Download Shows 556-564
Listen To Pronk Pops Podcast or Download Shows 546-555
Listen To Pronk Pops Podcast or Download Shows 538-545
Listen To Pronk Pops Podcast or Download Shows 532-537
Listen To Pronk Pops Podcast or Download Shows 526-531
Listen To Pronk Pops Podcast or Download Shows 519-525
Listen To Pronk Pops Podcast or Download Shows 510-518
Listen To Pronk Pops Podcast or Download Shows 500-509
Listen To Pronk Pops Podcast or Download Shows 490-499
Listen To Pronk Pops Podcast or Download Shows 480-489
Listen To Pronk Pops Podcast or Download Shows 473-479
Listen To Pronk Pops Podcast or Download Shows 464-472
Listen To Pronk Pops Podcast or Download Shows 455-463
Listen To Pronk Pops Podcast or Download Shows 447-454
Listen To Pronk Pops Podcast or Download Shows 439-446
Listen To Pronk Pops Podcast or Download Shows 431-438
Listen To Pronk Pops Podcast or Download Shows 422-430
Listen To Pronk Pops Podcast or Download Shows 414-421
Listen To Pronk Pops Podcast or Download Shows 408-413
Listen To Pronk Pops Podcast or Download Shows 400-407
Listen To Pronk Pops Podcast or Download Shows 391-399
Listen To Pronk Pops Podcast or Download Shows 383-390
Listen To Pronk Pops Podcast or Download Shows 376-382
Listen To Pronk Pops Podcast or Download Shows 369-375
Listen To Pronk Pops Podcast or Download Shows 360-368
Listen To Pronk Pops Podcast or Download Shows 354-359
Listen To Pronk Pops Podcast or Download Shows 346-353
Listen To Pronk Pops Podcast or Download Shows 338-345
Listen To Pronk Pops Podcast or Download Shows 328-337
Listen To Pronk Pops Podcast or Download Shows 319-327
Listen To Pronk Pops Podcast or Download Shows 307-318
Listen To Pronk Pops Podcast or Download Shows 296-306
Listen To Pronk Pops Podcast or Download Shows 287-295
Listen To Pronk Pops Podcast or Download Shows 277-286
Listen To Pronk Pops Podcast or Download Shows 264-276
Listen To Pronk Pops Podcast or Download Shows 250-263
Listen To Pronk Pops Podcast or Download Shows 236-249
Listen To Pronk Pops Podcast or Download Shows 222-235
Listen To Pronk Pops Podcast or Download Shows 211-221
Listen To Pronk Pops Podcast or Download Shows 202-210
Listen To Pronk Pops Podcast or Download Shows 194-201
Listen To Pronk Pops Podcast or Download Shows 184-193
Listen To Pronk Pops Podcast or Download Shows 174-183
Listen To Pronk Pops Podcast or Download Shows 165-173
Listen To Pronk Pops Podcast or Download Shows 158-164
Listen To Pronk Pops Podcast or Download Shows 151-157
Listen To Pronk Pops Podcast or Download Shows 143-150
Listen To Pronk Pops Podcast or Download Shows 135-142
Listen To Pronk Pops Podcast or Download Shows 131-134
Listen To Pronk Pops Podcast or Download Shows 124-130
Listen To Pronk Pops Podcast or Download Shows 121-123
Listen To Pronk Pops Podcast or Download Shows 118-120
Listen To Pronk Pops Podcast or Download Shows 113 -117
Listen To Pronk Pops Podcast or Download Show 112
Listen To Pronk Pops Podcast or Download Shows 108-111
Listen To Pronk Pops Podcast or Download Shows 106-108
Listen To Pronk Pops Podcast or Download Shows 104-105
Listen To Pronk Pops Podcast or Download Shows 101-103
Listen To Pronk Pops Podcast or Download Shows 98-100
Listen To Pronk Pops Podcast or Download Shows 94-97
Listen To Pronk Pops Podcast or Download Show 93
Listen To Pronk Pops Podcast or Download Show 92
Listen To Pronk Pops Podcast or Download Show 91
Listen To Pronk Pops Podcast or Download Shows 88-90
Listen To Pronk Pops Podcast or Download Shows 84-87
Listen To Pronk Pops Podcast or Download Shows 79-83
Listen To Pronk Pops Podcast or Download Shows 74-78
Listen To Pronk Pops Podcast or Download Shows 71-73
Listen To Pronk Pops Podcast or Download Shows 68-70
Listen To Pronk Pops Podcast or Download Shows 65-67
Listen To Pronk Pops Podcast or Download Shows 62-64
Listen To Pronk Pops Podcast or Download Shows 58-61
Listen To Pronk Pops Podcast or Download Shows 55-57
Listen To Pronk Pops Podcast or Download Shows 52-54
Listen To Pronk Pops Podcast or Download Shows 49-51
Listen To Pronk Pops Podcast or Download Shows 45-48
Listen To Pronk Pops Podcast or Download Shows 41-44
Listen To Pronk Pops Podcast or Download Shows 38-40
Listen To Pronk Pops Podcast or Download Shows 34-37
Listen To Pronk Pops Podcast or Download Shows 30-33
Listen To Pronk Pops Podcast or Download Shows 27-29
Listen To Pronk Pops Podcast or Download Shows 17-26
Listen To Pronk Pops Podcast or Download Shows 16-22
Listen To Pronk Pops Podcast or Download Shows 10-15
Listen To Pronk Pops Podcast or Download Shows 1-9
Read Full Post | Make a Comment ( None so far )