The Pronk Pops Show 1394, February 7, 2020, Story 1: Solid January 2020 Jobs Report: 225,000 New Non-farm Payroll Jobs Created in January and Labor Participation Rate Increased to 63.4% with Over 729,000 New Participants in Labor Force! — Videos — Story 2: U.S. Federal Budgetary Deficits, The National Debt and The Big Four Federal Spending: Social Security, Medicare, Defense and Medicaid — Videos — Story 3: President Trump Answers Big Lie Media Mob Question on Way To North Carolina — Trump Derangement Syndrome of REDS (Radical Extremist Democratic Socialists) in Congress — Videos

The Pronk Pops Show Podcasts
Pronk Pops Show 1394 February 7, 2020
Pronk Pops Show 1393 February 6, 2020
Pronk Pops Show 1392 February 5, 2020
Pronk Pops Show 1391 February 4, 2020
Pronk Pops Show 1390 February 3, 2020
Pronk Pops Show 1389 January 31, 2020
Pronk Pops Show 1388 January 30, 2020
Pronk Pops Show 1387 January 29, 2020
Pronk Pops Show 1386 January 28, 2020
Pronk Pops Show 1385 January 27, 2020
Pronk Pops Show 1384 January 24, 2020
Pronk Pops Show 1383 January 23, 2020
Pronk Pops Show 1382 January 22, 2020
Pronk Pops Show 1381 January 21, 2020
Pronk Pops Show 1380 January 17, 2020
Pronk Pops Show 1379 January 16, 2020
Pronk Pops Show 1378 January 15, 2020
Pronk Pops Show 1377 January 14, 2020
Pronk Pops Show 1376 January 13, 2020
Pronk Pops Show 1375 December 13, 2019
Pronk Pops Show 1374 December 12, 2019
Pronk Pops Show 1373 December 11, 2019
Pronk Pops Show 1372 December 10, 2019
Pronk Pops Show 1371 December 9, 2019
Pronk Pops Show 1370 December 6, 2019
Pronk Pops Show 1369 December 5, 2019
Pronk Pops Show 1368 December 4, 2019
Pronk Pops Show 1367 December 3, 2019
Pronk Pops Show 1366 December 2, 2019
Pronk Pops Show 1365 November 22, 2019
Pronk Pops Show 1364 November 21, 2019
Pronk Pops Show 1363 November 20, 2019
Pronk Pops Show 1362 November 19, 2019
Pronk Pops Show 1361 November 18, 2019
Pronk Pops Show 1360 November 15, 2019
Pronk Pops Show 1359 November 14, 2019
Pronk Pops Show 1358 November 13, 2019
Pronk Pops Show 1357 November 12, 2019
Pronk Pops Show 1356 November 11, 2019
Pronk Pops Show 1355 November 8, 2019
Pronk Pops Show 1354 November 7, 2019
Pronk Pops Show 1353 November 6, 2019
Pronk Pops Show 1352 November 5, 2019
Pronk Pops Show 1351 November 4, 2019
Pronk Pops Show 1350 November 1, 2019
;


Story 1: Solid January 2020 Jobs Report: 225,000 New Non-farm Payroll Jobs Created in January and Labor Participation Rate Increased to 63.4% with Over 729,000 New Participants in Labor Force! — Videos —
Alternate Unemployment Charts
The seasonally-adjusted SGS Alternate Unemployment Rate reflects current unemployment reporting methodology adjusted for SGS-estimated long-term discouraged workers, who were defined out of official existence in 1994. That estimate is added to the BLS estimate of U-6 unemployment, which includes short-term discouraged workers.
The U-3 unemployment rate is the monthly headline number. The U-6 unemployment rate is the Bureau of Labor Statistics’ (BLS) broadest unemployment measure, including short-term discouraged and other marginally-attached workers as well as those forced to work part-time because they cannot find full-time employment.
Public Commentary on Unemployment
Unemployment Data Series ![]() (Subscription required.) View Download Excel CSV File Last Updated: February 7th, 2020
(Subscription required.) View Download Excel CSV File Last Updated: February 7th, 2020
The ShadowStats Alternate Unemployment Rate for January 2020 is 21.0%.

http://www.shadowstats.com/alternate_data/unemployment-charts
Watch five experts break down the January jobs report
Outstanding January job report exceeds expectations with 225K jobs added
Kudlow: The economy is booming and jobs are booming
US economy adds 225,000 jobs in January
Mnuchin: We need to grow the economy faster than government spending
U.S. National Debt Clock
https://www.usdebtclock.org/
Will our national debt doom America?
Keiser Report: Economic Ghouls and Predators (E1498)
Keiser Report: All Rescue Roads Lead to the Elite (E1492)
US budget deficit tops $1 trillion as government spending increasesUS budget deficit tops $1 trillion as government spending increases
]
U.S. CBO Doesn’t Expect Economic Growth to Solve Deficit ‘Problem’
Deficits & Debts: Crash Course Economics #9
Deficits and debt | AP Macroeconomics | Khan Academy
63.4%: Labor Force Participation at Trump-Era High As Labor Force Grows by 574,000
President Donald Trump never misses an opportunity to plug the strong employment picture for which he takes credit, and today he earned more bragging rights:
The Labor Department’s Bureau of Labor Statistics said the economy created 225,000 in January, well above estimates. BLS says notable job gains occurred in construction, in health care, and in transportation and warehousing.
The number of employed Americans dipped in January to 158,714,000 — down 89,000 from December’s record high.
The unemployment rate ticked up a tenth of a point to 3.6 percent in January.
But the labor force participation rate reached a Trump-era high of 63.4 percent, up from 63.2 percent in December, because the civilian labor force increased by 574,000 in January, after accounting for annual adjustments to population controls, BLS said.*
In January, the civilian non-institutional population in the United States was 259,502,000. That included all people 16 and older who did not live in an institution (such as a prison, nursing home or long-term care facility).
Of that civilian non-institutional population, 164,606,000 were participating in the labor force, meaning that they either had a job or were actively seeking one during the last month. This resulted in a labor force participation rate of 63.4 percent, the highest it’s been since June 2013.
The number of Americans counted as not in the labor force — meaning they did not have a job and were not looking for one — dropped by 442,000 in January (after population control adjustments). This number hovers around 95,000,000, partly because of retiring baby boomers.
Among the major worker groups, the unemployment rates for adult men (3.3 percent), adult women (3.2 percent), teenagers (12.2 percent), Whites (3.1 percent), Blacks (6.0 percent), Asians (3.0 percent), and Hispanics (4.3 percent) showed little or no change over the month.
The change in total nonfarm payroll employment for November was revised up by 5,000 from +256,000 to +261,000, and the change for December was revised up by 2,000 from +145,000 to +147,000. With these revisions, employment gains in November and December combined were 7,000 higher than previously reported.
In January, average hourly earnings for all employees on private nonfarm payrolls rose by 7 cents to $28.44. Over the past 12 months, average hourly earnings have increased by 3.1 percent.
The current economic expansion, now in its 11th year, became the longest in U.S. history on July 1, 2019, beating the previous record that lasted from March 1991 through March 2001.
President Trump bragged about the economy Tuesday night in his State of the Union speech:
In just over two years since the election, we have launched an unprecedented economic boom — a boom that has rarely been seen before. There’s been nothing like it. We have created 5.3 million new jobs and, importantly, added 600,000 new manufacturing jobs — something which almost everyone said was impossible to do. But the fact is, we are just getting started.
Wages are rising at the fastest pace in decades and growing for blue-collar workers, who I promised to fight for. They’re growing faster than anyone else thought possible. Nearly 5 million Americans have been lifted off food stamps. The U.S. economy is growing almost twice as fast today as when I took office. And we are considered, far and away, the hottest economy anywhere in the world. Not even close.
Unemployment has reached the lowest rate in over half a century. African American, Hispanic American, and Asian American unemployment have all reached their lowest levels ever recorded. Unemployment for Americans with disabilities has also reached an all-time low. More people are working now than at any time in the history of our country — 157 million people at work.
*(BLS explained that the January 2020 data includes updated population estimates developed by the Census Bureau’s household survey. “Each year,” BLS said, “the Census Bureau updates the estimates to reflect new information and assumptions about the growth of the population since the previous decennial census. The change in population reflected in the new estimates results from adjustments for net international migration, updated vital statistics, and estimation methodology improvements.”)
https://cnsnews.com/article/national/susan-jones/634-labor-force-participation-trump-era-high
Employment Situation Summary
Transmission of material in this news release is embargoed until		USDL-20-0180
8:30 a.m. (EST) Friday, February 7, 2020

Technical information:
 Household data:	(202) 691-6378  *  cpsinfo@bls.gov  *  www.bls.gov/cps
 Establishment data:	(202) 691-6555  *  cesinfo@bls.gov  *  www.bls.gov/ces

Media contact:		(202) 691-5902  *  PressOffice@bls.gov


		        THE EMPLOYMENT SITUATION -- JANUARY 2020


Total nonfarm payroll employment rose by 225,000 in January, and the unemployment rate
was little changed at 3.6 percent, the U.S. Bureau of Labor Statistics reported today.
Notable job gains occurred in construction, in health care, and in transportation and
warehousing.

This news release presents statistics from two monthly surveys. The household survey
measures labor force status, including unemployment, by demographic characteristics.
The establishment survey measures nonfarm employment, hours, and earnings by industry.
For more information about the concepts and statistical methodology used in these two
surveys, see the Technical Note.

 ___________________________________________________________________________________
| 									            |
|                Changes to The Employment Situation Data		            |
|									            |
|   Establishment survey data have been revised as a result of the annual           |
|   benchmarking process and the updating of seasonal adjustment factors. In        |
|   addition, several changes have been made to household survey data, including    |
|   the annual update of population estimates. See the notes at the end of the      |
|   news release for more information.                                              |
|___________________________________________________________________________________|


Household Survey Data

Both the unemployment rate, at 3.6 percent, and the number of unemployed persons, at
5.9 million, changed little in January. (See table A-1. For information about annual
population adjustments to the household survey estimates, see the note at the end of
the news release and tables B and C.)

Among the major worker groups, the unemployment rates for adult men (3.3 percent),
adult women (3.2 percent), teenagers (12.2 percent), Whites (3.1 percent), Blacks
(6.0 percent), Asians (3.0 percent), and Hispanics (4.3 percent) showed little or
no change over the month. (See tables A-1, A-2, and A-3.)

Among the unemployed, the number of reentrants to the labor force increased by
183,000 in January to 1.8 million but was little changed over the year. (Reentrants
are persons who previously worked but were not in the labor force prior to beginning
their job search.) (See table A-11.)

The number of long-term unemployed (those jobless for 27 weeks or more), at 1.2 million,
was unchanged in January. These individuals accounted for 19.9 percent of the unemployed.
(See table A-12.)

After accounting for the annual adjustments to the population controls, the civilian
labor force rose by 574,000 in January, and the labor force participation rate edged
up by 0.2 percentage point to 63.4 percent. The employment-population ratio, at 61.2
percent, changed little over the month but was up by 0.5 percentage point over the year.
(See table A-1. For additional information about the effects of the population adjustments,
see table C.)

The number of persons employed part time for economic reasons, at 4.2 million, was
essentially unchanged in January. These individuals, who would have preferred full-time
employment, were working part time because their hours had been reduced or they were
unable to find full-time jobs. (See table A-8.)

The number of persons marginally attached to the labor force, at 1.3 million, changed
little in January. These individuals were not in the labor force, wanted and were available
for work, and had looked for a job sometime in the prior 12 months. They were not counted
as unemployed because they had not searched for work in the 4 weeks preceding the survey
for a variety of reasons, such as belief that no jobs are available for them (referred
to as discouraged workers), school attendance, or family responsibilities. Discouraged
workers numbered 337,000 in January, little changed over the month. (See Summary table A.)

Establishment Survey Data

Total nonfarm payroll employment increased by 225,000 in January, compared with an
average monthly gain of 175,000 in 2019. Notable job gains occurred in construction,
in health care, and in transportation and warehousing. (See table B-1. For information
about the annual benchmark process, see the note at the end of the news release and table A.)

In January, construction employment rose by 44,000. Most of the gain occurred in specialty
trade contractors, with increases in both the residential (+18,000) and nonresidential
(+17,000) components. Construction added an average of 12,000 jobs per month in 2019.

Health care added 36,000 jobs in January, with gains in ambulatory health care services
(+23,000) and hospitals (+10,000). Health care has added 361,000 jobs over the past 12 months.

Employment in transportation and warehousing increased by 28,000 in January. Job gains
occurred in couriers and messengers (+14,000) and in warehousing and storage (+6,000).
Over the year, employment in transportation and warehousing has increased by 106,000.

Employment in leisure and hospitality continued to trend up in January (+36,000). Over
the past 6 months, the industry has added 288,000 jobs.

Employment continued on an upward trend in professional and business services in January
(+21,000), increasing by 390,000 over the past 12 months.

Manufacturing employment changed little in January (-12,000) and has shown little movement,
on net, over the past 12 months. Motor vehicles and parts lost 11,000 jobs over the month.

Employment in other major industries, including mining, wholesale trade, retail trade,
information, financial activities, and government, changed little over the month.

In January, average hourly earnings for all employees on private nonfarm payrolls rose by
7 cents to $28.44. Over the past 12 months, average hourly earnings have increased by
3.1 percent. Average hourly earnings of private-sector production and nonsupervisory employees
were $23.87 in January, little changed over the month (+3 cents). (See tables B-3 and B-8.)

The average workweek for all employees on private nonfarm payrolls was unchanged at 34.3
hours in January. In manufacturing, the average workweek remained at 40.4 hours, while
overtime edged down 0.1 hour to 3.1 hours. The average workweek of private-sector production
and nonsupervisory employees edged up by 0.1 hour to 33.6 hours. (See tables B-2 and B-7.)

The change in total nonfarm payroll employment for November was revised up by 5,000 from
+256,000 to +261,000, and the change for December was revised up by 2,000 from +145,000 to
+147,000. With these revisions, employment gains in November and December combined were
7,000 higher than previously reported. (Monthly revisions result from additional reports
received from businesses and government agencies since the last published estimates and from
the recalculation of seasonal factors. The annual benchmark process also contributed to the
November and December revisions.) After revisions, job gains have averaged 211,000 over the
last 3 months.

_____________
The Employment Situation for February is scheduled to be released on
Friday, March 6, 2020, at 8:30 a.m. (EST).


 ____________________________________________________________________________________
|										     |
|                     Changes to Household Survey Data 				     |
|										     |
|   Effective with this news release, two not seasonally adjusted series previously  |
|   displayed in Summary table A--persons marginally attached to the labor force and |
|   discouraged workers--have been replaced with new seasonally adjusted series. The |
|   new seasonally adjusted series are available in the BLS online database back to  |
|   1994. Not seasonally adjusted data for persons marginally attached to the labor  |
|   force and for discouraged workers will continue to be published in table A-16.   |
|   These series are also available in the BLS online database back to 1994.         |
|                                                                                    |
|   Persons marginally attached to the labor force and discouraged workers are       |
|   inputs into three alternative measures of labor underutilization displayed in    |
|   table A-15. Effective with this news release, data for U-4, U-5, and U-6 in      |
|   table A-15 reflect the new seasonally adjusted series. Changes to historical     |
|   data were negligible. Revised data back to 1994 are available in the BLS online  |
|   database. Not seasonally adjusted series for the alternative measures are        |
|   unaffected.									     |
|										     |
|   Effective with data for January 2020, occupation estimates in table A-13         |
|   reflect the introduction of the 2018 Census occupation classification system     |
|   into the household survey. This occupation classification system is derived      |
|   from the 2018 Standard Occupational Classification (SOC) system. Historical      |
|   data have not been revised. Beginning with data for January 2020, occupation     |
|   estimates are not strictly comparable with earlier years.                        |
|                                                                                    |
|   In addition, industry estimates in table A-14 reflect the introduction of the    |
|   2017 Census industry classification system, which is derived from the 2017       |
|   North American Industry Classification System (NAICS). The classification        |
|   changes are minor and do not involve re-classification of industries between     |
|   the broader industry sectors.                                                    |
|										     |
|   Beginning with data for January 2020, marital status estimates are not strictly  |
|   comparable with earlier years. Estimates of married persons now refer to those   |
|   in opposite-sex and same-sex marriages. Prior to January 2020, these estimates   |
|   referred only to those in opposite-sex marriages. Persons with a same-sex	     |
|   spouse were previously classified in other marital status categories, such as    |
|   "women who maintain families." These changes affect marital status estimates in  |
|   tables A-9 and A-10. (Note that not all marital status categories are presented  |
|   in these tables. BLS has not separately tabulated estimates for persons with an  |
|   opposite-sex spouse and persons with a same-sex spouse.) Historical data have    |
|   not been revised.						                     |
|____________________________________________________________________________________|


                     Revisions to Establishment Survey Data


In accordance with annual practice, the establishment survey data released today
have been benchmarked to reflect comprehensive counts of payroll jobs for March 2019.
These counts are derived principally from the Quarterly Census of Employment and Wages
(QCEW), which counts jobs covered by the Unemployment Insurance (UI) tax system. The
benchmark process results in revisions to not seasonally adjusted data from April 2018
forward. BLS revised seasonally adjusted data from January 2015 forward. In addition,
both seasonally adjusted and unadjusted data for some series incorporate other
revisions prior to 2015.

The total nonfarm employment level for March 2019 was revised downward by 514,000
(-505,000 on a not seasonally adjusted basis), or -0.3 percent. The absolute average
benchmark revision over the past 10 years is 0.2 percent.

The over-the-year change in total nonfarm employment for 2019 was revised from
+2,108,000 to +2,096,000 (seasonally adjusted). Table A presents revised total nonfarm
employment data on a seasonally adjusted basis from January to December 2019.

All revised historical establishment survey data are available on the BLS website at
www.bls.gov/ces/data/home.htm. In addition, an article that discusses the benchmark
and post-benchmark revisions and other technical issues is available at
www.bls.gov/web/empsit/cesbmart.htm.


Table A. Revisions to total nonfarm employment, January to December 2019, seasonally
adjusted
(Numbers in thousands)
---------------------------------------------------------------------------------------
                 |                                   |
                 |                Level              |      Over-the-month change
                 |---------------------------------------------------------------------
 Year and month  |           |    As     |           |           |    As    |
                 |    As     |previously | Difference|    As     |previously| Difference
                 |  revised  |published  |           |  revised  |published |
---------------------------------------------------------------------------------------
                 |           |           |           |           |          |
       2019      |           |           |           |           |          |
                 |           |           |           |           |          |
January......... |  150,134  |  150,587  |    -453   |    269    |    312   |   -43
February........ |  150,135  |  150,643  |    -508   |      1    |     56   |   -55
March........... |  150,282  |  150,796  |    -514   |    147    |    153   |    -6
April........... |  150,492  |  151,012  |    -520   |    210    |    216   |    -6
May............. |  150,577  |  151,074  |    -497   |     85    |     62   |    23
June............ |  150,759  |  151,252  |    -493   |    182    |    178   |     4
July............ |  150,953  |  151,418  |    -465   |    194    |    166   |    28
August.......... |  151,160  |  151,637  |    -477   |    207    |    219   |   -12
September....... |  151,368  |  151,830  |    -462   |    208    |    193   |    15
October......... |  151,553  |  151,982  |    -429   |    185    |    152   |    33
November........ |  151,814  |  152,238  |    -424   |    261    |    256   |     5
December(p)..... |  151,961  |  152,383  |    -422   |    147    |    145   |     2
---------------------------------------------------------------------------------------
   (p) = preliminary.


                Adjustments to Population Estimates for the Household Survey


Effective with data for January 2020, updated population estimates were incorporated into
the household survey. Population estimates for the household survey are developed by the
U.S. Census Bureau. Each year, the Census Bureau updates the estimates to reflect new
information and assumptions about the growth of the population since the previous decennial
census. The change in population reflected in the new estimates results from adjustments
for net international migration, updated vital statistics, and estimation methodology
improvements.

In accordance with usual practice, BLS will not revise the official household survey estimates
for December 2019 and earlier months. To show the impact of the population adjustments,
however, differences in selected December 2019 labor force series based on the old and new
population estimates are shown in table B.

The adjustments decreased the estimated size of the civilian noninstitutional population in
December by 811,000, the civilian labor force by 524,000, employment by 507,000, and
unemployment by 17,000. The number of persons not in the labor force was decreased by 287,000.
The total unemployment rate, employment-population ratio, and labor force participation rate
were unaffected.

Data users are cautioned that these annual population adjustments can affect the comparability
of household data series over time. Table C shows the effect of the introduction of new
population estimates on the comparison of selected labor force measures between December 2019
and January 2020. Additional information on the population adjustments and their effect on
national labor force estimates is available at
www.bls.gov/web/empsit/cps-pop-control-adjustments.pdf.

Population controls for veterans, which are derived from a Department of Veterans Affairs'
population model and are updated periodically, have also been updated with the release of
data for January 2020. Historical data have not been revised.
| Category | Total | Men | Women | White | Black or African Ameri- can |
Asian | Hispanic or Latino ethnicity |
|---|---|---|---|---|---|---|---|
|
Civilian noninstitutional population |
-811 | -403 | -408 | -461 | -59 | -273 | -323 |
|
Civilian labor force |
-524 | -289 | -235 | -297 | -41 | -171 | -219 |
|
Participation rate |
0 | 0 | 0 | 0 | 0 | 0 | -0.1 |
|
Employed |
-507 | -279 | -227 | -287 | -39 | -167 | -210 |
|
Employment-population ratio |
0 | 0 | 0 | 0 | 0 | 0 | 0 |
|
Unemployed |
-17 | -10 | -9 | -10 | -2 | -4 | -9 |
|
Unemployment rate |
0 | 0 | 0 | 0 | 0 | 0 | 0 |
|
Not in labor force |
-287 | -115 | -172 | -164 | -18 | -102 | -104 |
|
NOTE: Detail may not sum to totals because of rounding. Estimates for the above race groups (White, Black or African American, and Asian) do not sum to totals because data are not presented for all races. Persons whose ethnicity is identified as Hispanic or Latino may be of any race. |
|||||||
| Category | Dec.-Jan. change, as published |
2020 population control effect |
Dec.-Jan. change, after removing the population control effect(1) |
|---|---|---|---|
|
Civilian noninstitutional population |
-679 | -811 | 132 |
|
Civilian labor force |
50 | -524 | 574 |
|
Participation rate |
0.2 | 0 | 0.2 |
|
Employed |
-89 | -507 | 418 |
|
Employment-population ratio |
0.2 | 0 | 0.2 |
|
Unemployed |
139 | -17 | 156 |
|
Unemployment rate |
0.1 | 0 | 0.1 |
|
Not in labor force |
-729 | -287 | -442 |
|
(1) This Dec.-Jan. change is calculated by subtracting the population control effect from the over-the-month change in the published seasonally adjusted estimates. |
|||
https://www.bls.gov/news.release/empsit.nr0.htm
Employment Situation Summary Table A. Household data, seasonally adjusted
| Category | Jan. 2019 |
Nov. 2019 |
Dec. 2019 |
Jan. 2020 |
Change from: Dec. 2019- Jan. 2020 |
|---|---|---|---|---|---|
|
Employment status |
|||||
|
Civilian noninstitutional population |
258,239 | 260,020 | 260,181 | 259,502 | – |
|
Civilian labor force |
163,142 | 164,347 | 164,556 | 164,606 | – |
|
Participation rate |
63.2 | 63.2 | 63.2 | 63.4 | – |
|
Employed |
156,627 | 158,536 | 158,803 | 158,714 | – |
|
Employment-population ratio |
60.7 | 61.0 | 61.0 | 61.2 | – |
|
Unemployed |
6,516 | 5,811 | 5,753 | 5,892 | – |
|
Unemployment rate |
4.0 | 3.5 | 3.5 | 3.6 | – |
|
Not in labor force |
95,097 | 95,673 | 95,625 | 94,896 | – |
|
Unemployment rates |
|||||
|
Total, 16 years and over |
4.0 | 3.5 | 3.5 | 3.6 | – |
|
Adult men (20 years and over) |
3.7 | 3.2 | 3.1 | 3.3 | – |
|
Adult women (20 years and over) |
3.6 | 3.2 | 3.2 | 3.2 | – |
|
Teenagers (16 to 19 years) |
12.9 | 12.0 | 12.6 | 12.2 | – |
|
White |
3.5 | 3.2 | 3.2 | 3.1 | – |
|
Black or African American |
6.8 | 5.6 | 5.9 | 6.0 | – |
|
Asian |
3.1 | 2.6 | 2.5 | 3.0 | – |
|
Hispanic or Latino ethnicity |
4.8 | 4.2 | 4.2 | 4.3 | – |
|
Total, 25 years and over |
3.2 | 2.9 | 2.8 | 2.9 | – |
|
Less than a high school diploma |
5.7 | 5.3 | 5.2 | 5.5 | – |
|
High school graduates, no college |
3.7 | 3.7 | 3.7 | 3.8 | – |
|
Some college or associate degree |
3.4 | 2.9 | 2.7 | 2.8 | – |
|
Bachelor’s degree and higher |
2.4 | 2.0 | 1.9 | 2.0 | – |
|
Reason for unemployment |
|||||
|
Job losers and persons who completed temporary jobs |
3,060 | 2,804 | 2,686 | 2,665 | – |
|
Job leavers |
816 | 776 | 829 | 836 | – |
|
Reentrants |
1,944 | 1,663 | 1,655 | 1,838 | – |
|
New entrants |
607 | 581 | 551 | 557 | – |
|
Duration of unemployment |
|||||
|
Less than 5 weeks |
2,319 | 2,026 | 2,065 | 2,059 | – |
|
5 to 14 weeks |
1,999 | 1,753 | 1,730 | 1,755 | – |
|
15 to 26 weeks |
898 | 865 | 812 | 887 | – |
|
27 weeks and over |
1,259 | 1,219 | 1,186 | 1,166 | – |
|
Employed persons at work part time |
|||||
|
Part time for economic reasons |
5,105 | 4,288 | 4,148 | 4,182 | – |
|
Slack work or business conditions |
3,402 | 2,634 | 2,657 | 2,655 | – |
|
Could only find part-time work |
1,413 | 1,259 | 1,215 | 1,294 | – |
|
Part time for noneconomic reasons |
20,984 | 21,532 | 21,586 | 22,154 | – |
|
Persons not in the labor force |
|||||
|
Marginally attached to the labor force |
1,498 | 1,244 | 1,230 | 1,342 | – |
|
Discouraged workers |
418 | 316 | 289 | 337 | – |
|
– December – January changes in household data are not shown due to the introduction of updated population controls.
|
|||||
Employment Situation Summary Table B. Establishment data, seasonally adjusted
| Category | Jan. 2019 |
Nov. 2019 |
Dec. 2019(P) |
Jan. 2020(P) |
|---|---|---|---|---|
|
EMPLOYMENT BY SELECTED INDUSTRY |
||||
|
Total nonfarm |
269 | 261 | 147 | 225 |
|
Total private |
258 | 247 | 142 | 206 |
|
Goods-producing |
75 | 45 | -5 | 32 |
|
Mining and logging |
5 | -11 | -11 | 0 |
|
Construction |
50 | -2 | 11 | 44 |
|
Manufacturing |
20 | 58 | -5 | -12 |
|
Durable goods(1) |
21 | 45 | -1 | -11 |
|
Motor vehicles and parts |
-0.3 | 40.5 | 1.3 | -10.6 |
|
Nondurable goods |
-1 | 13 | -4 | -1 |
|
Private service-providing |
183 | 202 | 147 | 174 |
|
Wholesale trade |
6.3 | 3.0 | 9.5 | 8.4 |
|
Retail trade |
-7.9 | -13.9 | 44.9 | -8.3 |
|
Transportation and warehousing |
46.8 | 22.6 | 3.9 | 28.3 |
|
Utilities |
0.1 | 1.0 | 0.7 | -1.4 |
|
Information |
-11 | 9 | 8 | 5 |
|
Financial activities |
11 | 12 | 5 | -1 |
|
Professional and business services(1) |
-2 | 37 | 14 | 21 |
|
Temporary help services |
-28.2 | 2.6 | 5.9 | -1.5 |
|
Education and health services(1) |
56 | 73 | 22 | 72 |
|
Health care and social assistance |
37.6 | 56.7 | 25.0 | 47.2 |
|
Leisure and hospitality |
81 | 43 | 36 | 36 |
|
Other services |
3 | 16 | 3 | 14 |
|
Government |
11 | 14 | 5 | 19 |
|
(3-month average change, in thousands) |
||||
|
Total nonfarm |
195 | 218 | 198 | 211 |
|
Total private |
188 | 211 | 193 | 198 |
|
WOMEN AND PRODUCTION AND NONSUPERVISORY EMPLOYEES |
||||
|
Total nonfarm women employees |
49.7 | 50.0 | 50.0 | 50.0 |
|
Total private women employees |
48.3 | 48.6 | 48.7 | 48.7 |
|
Total private production and nonsupervisory employees |
82.4 | 82.2 | 82.2 | 82.2 |
|
HOURS AND EARNINGS |
||||
|
Total private |
||||
|
Average weekly hours |
34.5 | 34.3 | 34.3 | 34.3 |
|
Average hourly earnings |
$27.58 | $28.34 | $28.37 | $28.44 |
|
Average weekly earnings |
$951.51 | $972.06 | $973.09 | $975.49 |
|
Index of aggregate weekly hours (2007=100)(3) |
110.5 | 111.2 | 111.3 | 111.5 |
|
Over-the-month percent change |
0.2 | -0.1 | 0.1 | 0.2 |
|
Index of aggregate weekly payrolls (2007=100)(4) |
145.8 | 150.7 | 151.0 | 151.6 |
|
Over-the-month percent change |
0.4 | 0.3 | 0.2 | 0.4 |
|
DIFFUSION INDEX |
||||
|
Total private (258 industries) |
62.2 | 63.4 | 55.6 | 59.7 |
|
Manufacturing (76 industries) |
59.2 | 61.8 | 46.1 | 46.7 |
|
Footnotes |
||||
|
NOTE: Data have been revised to reflect March 2019 benchmark levels and updated seasonal adjustment factors.
|
||||
https://www.bls.gov/news.release/empsit.b.htm
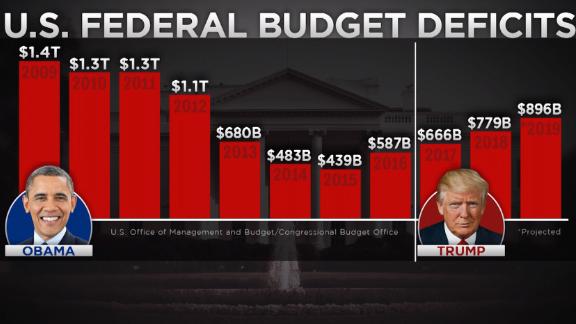
Story 2: U.S. Federal Budgetary Deficits, The National Debt and The Big Four Federal Spending: Social Security, Medicare, Defense and Medicaid — Videos


Reorganizing the Federal Government: What Needs to Be Done and How to Do It
John Stossel – Downsizing Government
Story 3: President Trump Answers Big Lie Media Mob Question on Way To North Carolina — Trump Derangement Syndrome of REDS (Radical Extremist Democratic Socialists) in Congress — Videos
Trump: They should expunge impeachment in the House, it was a ‘hoax’
The Pronk Pops Show Podcasts Portfolio
Listen To Pronk Pops Podcast or Download Shows 1392-1394
Listen To Pronk Pops Podcast or Download Shows 1386-1391
Listen To Pronk Pops Podcast or Download Shows 1379-1785
Listen To Pronk Pops Podcast or Download Shows 1372-1378
Listen To Pronk Pops Podcast or Download Shows 1363-1371
Listen To Pronk Pops Podcast or Download Shows 1352-1362
Listen To Pronk Pops Podcast or Download Shows 1343-1351
Listen To Pronk Pops Podcast or Download Shows 1335-1342
Listen To Pronk Pops Podcast or Download Shows 1326-1334
Listen To Pronk Pops Podcast or Download Shows 1318-1325
Listen To Pronk Pops Podcast or Download Shows 1310-1317
Listen To Pronk Pops Podcast or Download Shows 1300-1309
Listen To Pronk Pops Podcast or Download Shows 1291-1299
Listen To Pronk Pops Podcast or Download Shows 1282-1290
Listen To Pronk Pops Podcast or Download Shows 1276-1281
Listen To Pronk Pops Podcast or Download Shows 1267-1275
Listen To Pronk Pops Podcast or Download Shows 1266
Listen To Pronk Pops Podcast or Download Shows 1256-1265
Listen To Pronk Pops Podcast or Download Shows 1246-1255
Listen To Pronk Pops Podcast or Download Shows 1236-1245
Listen To Pronk Pops Podcast or Download Shows 1229-1235
Listen To Pronk Pops Podcast or Download Shows 1218-1128
Listen To Pronk Pops Podcast or Download Shows 1210-1217
Listen To Pronk Pops Podcast or Download Shows 1202-1209
Listen To Pronk Pops Podcast or Download Shows 1197-1201
Listen To Pronk Pops Podcast or Download Shows 1190-1196
Listen To Pronk Pops Podcast or Download Shows 1182-1189
Listen To Pronk Pops Podcast or Download Shows 1174-1181
Listen To Pronk Pops Podcast or Download Shows 1168-1173
Listen To Pronk Pops Podcast or Download Shows 1159-1167
Listen To Pronk Pops Podcast or Download Shows 1151-1158
Listen To Pronk Pops Podcast or Download Shows 1145-1150
Listen To Pronk Pops Podcast or Download Shows 1139-1144
Listen To Pronk Pops Podcast or Download Shows 1131-1138
Listen To Pronk Pops Podcast or Download Shows 1122-1130
Listen To Pronk Pops Podcast or Download Shows 1112-1121
Listen To Pronk Pops Podcast or Download Shows 1101-1111
Listen To Pronk Pops Podcast or Download Shows 1091-1100
Listen To Pronk Pops Podcast or Download Shows 1082-1090
Listen To Pronk Pops Podcast or Download Shows 1073-1081
Listen To Pronk Pops Podcast or Download Shows 1066-1073
Listen To Pronk Pops Podcast or Download Shows 1058-1065
Listen To Pronk Pops Podcast or Download Shows 1048-1057
Listen To Pronk Pops Podcast or Download Shows 1041-1047
Listen To Pronk Pops Podcast or Download Shows 1033-1040
Listen To Pronk Pops Podcast or Download Shows 1023-1032
Listen To Pronk Pops Podcast or Download Shows 1017-1022
Listen To Pronk Pops Podcast or Download Shows 1010-1016
Listen To Pronk Pops Podcast or Download Shows 1001-1009
Listen To Pronk Pops Podcast or Download Shows 993-1000
Listen To Pronk Pops Podcast or Download Shows 984-992
Listen To Pronk Pops Podcast or Download Shows 977-983
Listen To Pronk Pops Podcast or Download Shows 970-976
Listen To Pronk Pops Podcast or Download Shows 963-969
Listen To Pronk Pops Podcast or Download Shows 955-962
Listen To Pronk Pops Podcast or Download Shows 946-954
Listen To Pronk Pops Podcast or Download Shows 938-945
Listen To Pronk Pops Podcast or Download Shows 926-937
Listen To Pronk Pops Podcast or Download Shows 916-925
Listen To Pronk Pops Podcast or Download Shows 906-915
Listen To Pronk Pops Podcast or Download Shows 889-896
Listen To Pronk Pops Podcast or Download Shows 884-888
Listen To Pronk Pops Podcast or Download Shows 878-883
Listen To Pronk Pops Podcast or Download Shows 870-877
Listen To Pronk Pops Podcast or Download Shows 864-869
Listen To Pronk Pops Podcast or Download Shows 857-863
Listen To Pronk Pops Podcast or Download Shows 850-856
Listen To Pronk Pops Podcast or Download Shows 845-849
Listen To Pronk Pops Podcast or Download Shows 840-844
Listen To Pronk Pops Podcast or Download Shows 833-839
Listen To Pronk Pops Podcast or Download Shows 827-832
Listen To Pronk Pops Podcast or Download Shows 821-826
Listen To Pronk Pops Podcast or Download Shows 815-820
Listen To Pronk Pops Podcast or Download Shows 806-814
Listen To Pronk Pops Podcast or Download Shows 800-805
Listen To Pronk Pops Podcast or Download Shows 793-799
Listen To Pronk Pops Podcast or Download Shows 785-792
Listen To Pronk Pops Podcast or Download Shows 777-784
Listen To Pronk Pops Podcast or Download Shows 769-776
Listen To Pronk Pops Podcast or Download Shows 759-768
Listen To Pronk Pops Podcast or Download Shows 751-758
Listen To Pronk Pops Podcast or Download Shows 745-750
Listen To Pronk Pops Podcast or Download Shows 738-744
Listen To Pronk Pops Podcast or Download Shows 732-737
Listen To Pronk Pops Podcast or Download Shows 727-731
Listen To Pronk Pops Podcast or Download Shows 720-726
Listen To Pronk Pops Podcast or Download Shows 713-719
Listen To Pronk Pops Podcast or Download Shows 705-712
Listen To Pronk Pops Podcast or Download Shows 695-704
Listen To Pronk Pops Podcast or Download Shows 685-694
Listen To Pronk Pops Podcast or Download Shows 675-684
Listen To Pronk Pops Podcast or Download Shows 668-674
Listen To Pronk Pops Podcast or Download Shows 660-667
Listen To Pronk Pops Podcast or Download Shows 651-659
Listen To Pronk Pops Podcast or Download Shows 644-650
Listen To Pronk Pops Podcast or Download Shows 637-643
Listen To Pronk Pops Podcast or Download Shows 629-636
Listen To Pronk Pops Podcast or Download Shows 617-628
Listen To Pronk Pops Podcast or Download Shows 608-616
Listen To Pronk Pops Podcast or Download Shows 599-607
Listen To Pronk Pops Podcast or Download Shows 590-598
Listen To Pronk Pops Podcast or Download Shows 585- 589
Listen To Pronk Pops Podcast or Download Shows 575-584
Listen To Pronk Pops Podcast or Download Shows 565-574
Listen To Pronk Pops Podcast or Download Shows 556-564
Listen To Pronk Pops Podcast or Download Shows 546-555
Listen To Pronk Pops Podcast or Download Shows 538-545
Listen To Pronk Pops Podcast or Download Shows 532-537
Listen To Pronk Pops Podcast or Download Shows 526-531
Listen To Pronk Pops Podcast or Download Shows 519-525
Listen To Pronk Pops Podcast or Download Shows 510-518
Listen To Pronk Pops Podcast or Download Shows 526-531
Listen To Pronk Pops Podcast or Download Shows 519-525
Listen To Pronk Pops Podcast or Download Shows 510-518
Listen To Pronk Pops Podcast or Download Shows 500-509
Listen To Pronk Pops Podcast or Download Shows 490-499
Listen To Pronk Pops Podcast or Download Shows 480-489
Listen To Pronk Pops Podcast or Download Shows 473-479
Listen To Pronk Pops Podcast or Download Shows 464-472
Listen To Pronk Pops Podcast or Download Shows 455-463
Listen To Pronk Pops Podcast or Download Shows 447-454
Listen To Pronk Pops Podcast or Download Shows 439-446
Listen To Pronk Pops Podcast or Download Shows 431-438
Listen To Pronk Pops Podcast or Download Shows 422-430
Listen To Pronk Pops Podcast or Download Shows 414-421
Listen To Pronk Pops Podcast or Download Shows 408-413
Listen To Pronk Pops Podcast or Download Shows 400-407
Listen To Pronk Pops Podcast or Download Shows 391-399
Listen To Pronk Pops Podcast or Download Shows 383-390
Listen To Pronk Pops Podcast or Download Shows 376-382
Listen To Pronk Pops Podcast or Download Shows 369-375
Listen To Pronk Pops Podcast or Download Shows 360-368
Listen To Pronk Pops Podcast or Download Shows 354-359
Listen To Pronk Pops Podcast or Download Shows 346-353
Listen To Pronk Pops Podcast or Download Shows 338-345
Listen To Pronk Pops Podcast or Download Shows 328-337
Listen To Pronk Pops Podcast or Download Shows 319-327
Listen To Pronk Pops Podcast or Download Shows 307-318
Listen To Pronk Pops Podcast or Download Shows 296-306
Listen To Pronk Pops Podcast or Download Shows 287-295
Listen To Pronk Pops Podcast or Download Shows 277-286
Listen To Pronk Pops Podcast or Download Shows 264-276
Listen To Pronk Pops Podcast or Download Shows 250-263
Listen To Pronk Pops Podcast or Download Shows 236-249
Listen To Pronk Pops Podcast or Download Shows 222-235
Listen To Pronk Pops Podcast or Download Shows 211-221
Listen To Pronk Pops Podcast or Download Shows 202-210
Listen To Pronk Pops Podcast or Download Shows 194-201
Listen To Pronk Pops Podcast or Download Shows 184-193
Listen To Pronk Pops Podcast or Download Shows 174-183
Listen To Pronk Pops Podcast or Download Shows 165-173
Listen To Pronk Pops Podcast or Download Shows 158-164
Listen To Pronk Pops Podcast or Download Shows 151-157
Listen To Pronk Pops Podcast or Download Shows 143-150
Listen To Pronk Pops Podcast or Download Shows 135-142
Listen To Pronk Pops Podcast or Download Shows 131-134
Listen To Pronk Pops Podcast or Download Shows 124-130
Listen To Pronk Pops Podcast or Download Shows 121-123
Listen To Pronk Pops Podcast or Download Shows 118-120
Listen To Pronk Pops Podcast or Download Shows 113 -117
Listen To Pronk Pops Podcast or Download Show 112
Listen To Pronk Pops Podcast or Download Shows 108-111
Listen To Pronk Pops Podcast or Download Shows 106-108
Listen To Pronk Pops Podcast or Download Shows 104-105
Listen To Pronk Pops Podcast or Download Shows 101-103
Listen To Pronk Pops Podcast or Download Shows 98-100
Listen To Pronk Pops Podcast or Download Shows 94-97
Listen To Pronk Pops Podcast or Download Show 93
Listen To Pronk Pops Podcast or Download Show 92
Listen To Pronk Pops Podcast or Download Show 91
Listen To Pronk Pops Podcast or Download Shows 88-90
Listen To Pronk Pops Podcast or Download Shows 84-87
Listen To Pronk Pops Podcast or Download Shows 79-83
Listen To Pronk Pops Podcast or Download Shows 74-78
Listen To Pronk Pops Podcast or Download Shows 71-73
Listen To Pronk Pops Podcast or Download Shows 68-70
Listen To Pronk Pops Podcast or Download Shows 65-67
Listen To Pronk Pops Podcast or Download Shows 62-64
Listen To Pronk Pops Podcast or Download Shows 58-61
Listen To Pronk Pops Podcast or Download Shows 55-57
Listen To Pronk Pops Podcast or Download Shows 52-54
Listen To Pronk Pops Podcast or Download Shows 49-51
Listen To Pronk Pops Podcast or Download Shows 45-48
Listen To Pronk Pops Podcast or Download Shows 41-44
Listen To Pronk Pops Podcast or Download Shows 38-40
Listen To Pronk Pops Podcast or Download Shows 34-37
Listen To Pronk Pops Podcast or Download Shows 30-33
Listen To Pronk Pops Podcast or Download Shows 27-29
Listen To Pronk Pops Podcast or Download Shows 17-26
Listen To Pronk Pops Podcast or Download Shows 16-22
Listen To Pronk Pops Podcast or Download Shows 10-15
Listen To Pronk Pops Podcast or Download Shows 1-9

Leave a comment