The Pronk Pops Show 1010, December 8, 2017, Story 1: Labor Participation Rate In November 2017 Remained At 62.7% with Over 95.4 Million Not in Labor Force With 160.5 Million In Labor Force –U-3 Unemployment Rate Hit Low 4.1% and U-6 Unemployment Rate Rose To 8.0% — Total Non-farm Payroll Jobs Added 228,000 — Videos — Story 2: Corporate Tax Cut Bill Will Pass By December 22, 2017 — Definitively Not Fundamental Tax Reform For The Middle Class — Replace Income Tax System with A Single Broad Based Consumption Tax Replacing All Federal Income Based Taxes — Videos — Story 3: Defeating The Islamic State in Iraq and Syria By Bombing Them To Death — ISIS Free? — Videos
Story 1: Labor Participation Rate In November 2017 Remained At 62.7% with Over 95.4 Million Not in Labor Force With 160.5 Million In Labor Force –U-3 Unemployment Rate Hit Low 4.1% and U-6 Unemployment Rate Rose To 8.0% — Total Non-farm Payroll Jobs Added 228,000 — Videos —
US economy adds 228K jobs in November
Analyzing The November Jobs Report Compared To Previous Years | Velshi & Ruhle | MSNBC
U.S. economy continues its strong performance
National Economic Council Director Gary Cohn: Tax Reform Will Help Us Drive Real Wage Growth | CNBC
CNN’s Christine Romans Highlights November’s Really Good Jobs Numbers
Larry Kudlow: Jobs Report Shows We Are On Front End Of “Very, Very Strong Rebound In Manufacturing”
Panel on Strong November Jobs Report; 228K Jobs Added. #Economy #Jobs #Report #November
Stockman: Here’s Why Today’s Jobs Report Is Nothing to Celebrate
Alan Greenspan // We are about to go from stagnation to ‘stagflation’
Ep. 307: Trump Continues What He Once Called the Biggest Hoax in American Politics
The Reason Trump is President – Peter Schiff
Civilian Labor Force Level
160,529,000
Labor Force Statistics from the Current Population Survey
Series Id:           LNS11000000
Seasonally Adjusted
Series title:        (Seas) Civilian Labor Force Level
Labor force status:  Civilian labor force
Type of data:        Number in thousands
Age:                 16 years and over
Download:
Year
Jan
Feb
Mar
Apr
May
Jun
Jul
Aug
Sep
Oct
Nov
Dec
Annual
2000
142267(1)
142456
142434
142751
142388
142591
142278
142514
142518
142622
142962
143248
2001
143800
143701
143924
143569
143318
143357
143654
143284
143989
144086
144240
144305
2002
143883
144653
144481
144725
144938
144808
144803
145009
145552
145314
145041
145066
2003
145937(1)
146100
146022
146474
146500
147056
146485
146445
146530
146716
147000
146729
2004
146842(1)
146709
146944
146850
147065
147460
147692
147564
147415
147793
148162
148059
2005
148029(1)
148364
148391
148926
149261
149238
149432
149779
149954
150001
150065
150030
2006
150214(1)
150641
150813
150881
151069
151354
151377
151716
151662
152041
152406
152732
2007
153144(1)
152983
153051
152435
152670
153041
153054
152749
153414
153183
153835
153918
2008
154063(1)
153653
153908
153769
154303
154313
154469
154641
154570
154876
154639
154655
2009
154210(1)
154538
154133
154509
154747
154716
154502
154307
153827
153784
153878
153111
2010
153484(1)
153694
153954
154622
154091
153616
153691
154086
153975
153635
154125
153650
2011
153263(1)
153214
153376
153543
153479
153346
153288
153760
154131
153961
154128
153995
2012
154381(1)
154671
154749
154545
154866
155083
154948
154763
155160
155554
155338
155628
2013
155695(1)
155268
154990
155356
155514
155747
155669
155587
155731
154709
155328
155151
2014
155295(1)
155485
156115
155378
155559
155682
156098
156117
156100
156389
156421
156238
2015
157022(1)
156771
156781
157043
157447
156993
157125
157109
156809
157123
157358
157957
2016
158362(1)
158888
159278
158938
158510
158889
159295
159508
159830
159643
159456
159640
2017
159716(1)
160056
160201
160213
159784
160145
160494
160571
161146
160381
160529
1 : Data affected by changes in population controls.
Labor Force Participation Rate
62.7%
Series Id:           LNS11300000
Seasonally Adjusted
Series title:        (Seas) Labor Force Participation Rate
Labor force status:  Civilian labor force participation rate
Type of data:        Percent or rate
Age:                 16 years and over
Download:
Year
Jan
Feb
Mar
Apr
May
Jun
Jul
Aug
Sep
Oct
Nov
Dec
Annual
2000
67.3
67.3
67.3
67.3
67.1
67.1
66.9
66.9
66.9
66.8
66.9
67.0
2001
67.2
67.1
67.2
66.9
66.7
66.7
66.8
66.5
66.8
66.7
66.7
66.7
2002
66.5
66.8
66.6
66.7
66.7
66.6
66.5
66.6
66.7
66.6
66.4
66.3
2003
66.4
66.4
66.3
66.4
66.4
66.5
66.2
66.1
66.1
66.1
66.1
65.9
2004
66.1
66.0
66.0
65.9
66.0
66.1
66.1
66.0
65.8
65.9
66.0
65.9
2005
65.8
65.9
65.9
66.1
66.1
66.1
66.1
66.2
66.1
66.1
66.0
66.0
2006
66.0
66.1
66.2
66.1
66.1
66.2
66.1
66.2
66.1
66.2
66.3
66.4
2007
66.4
66.3
66.2
65.9
66.0
66.0
66.0
65.8
66.0
65.8
66.0
66.0
2008
66.2
66.0
66.1
65.9
66.1
66.1
66.1
66.1
66.0
66.0
65.9
65.8
2009
65.7
65.8
65.6
65.7
65.7
65.7
65.5
65.4
65.1
65.0
65.0
64.6
2010
64.8
64.9
64.9
65.2
64.9
64.6
64.6
64.7
64.6
64.4
64.6
64.3
2011
64.2
64.1
64.2
64.2
64.1
64.0
64.0
64.1
64.2
64.1
64.1
64.0
2012
63.7
63.8
63.8
63.7
63.7
63.8
63.7
63.5
63.6
63.8
63.6
63.7
2013
63.6
63.4
63.3
63.4
63.4
63.4
63.3
63.3
63.3
62.8
63.0
62.9
2014
62.9
62.9
63.1
62.8
62.8
62.8
62.9
62.9
62.8
62.9
62.9
62.7
2015
62.9
62.7
62.7
62.8
62.9
62.6
62.6
62.6
62.4
62.5
62.5
62.7
2016
62.7
62.9
63.0
62.8
62.6
62.7
62.8
62.8
62.9
62.8
62.6
62.7
2017
62.9
63.0
63.0
62.9
62.7
62.8
62.9
62.9
63.1
62.7
62.7
Unemployment Level
6.6 Million
Series Id:           LNS13000000
Seasonally Adjusted
Series title:        (Seas) Unemployment Level
Labor force status:  Unemployed
Type of data:        Number in thousands
Age:                 16 years and over
Year
Jan
Feb
Mar
Apr
May
Jun
Jul
Aug
Sep
Oct
Nov
Dec
Annual
2000
5708
5858
5733
5481
5758
5651
5747
5853
5625
5534
5639
5634
2001
6023
6089
6141
6271
6226
6484
6583
7042
7142
7694
8003
8258
2002
8182
8215
8304
8599
8399
8393
8390
8304
8251
8307
8520
8640
2003
8520
8618
8588
8842
8957
9266
9011
8896
8921
8732
8576
8317
2004
8370
8167
8491
8170
8212
8286
8136
7990
7927
8061
7932
7934
2005
7784
7980
7737
7672
7651
7524
7406
7345
7553
7453
7566
7279
2006
7064
7184
7072
7120
6980
7001
7175
7091
6847
6727
6872
6762
2007
7116
6927
6731
6850
6766
6979
7149
7067
7170
7237
7240
7645
2008
7685
7497
7822
7637
8395
8575
8937
9438
9494
10074
10538
11286
2009
12058
12898
13426
13853
14499
14707
14601
14814
15009
15352
15219
15098
2010
15046
15113
15202
15325
14849
14474
14512
14648
14579
14516
15081
14348
2011
14013
13820
13737
13957
13855
13962
13763
13818
13948
13594
13302
13093
2012
12797
12813
12713
12646
12660
12692
12656
12471
12115
12124
12005
12298
2013
12470
11954
11672
11752
11657
11741
11350
11284
11264
11133
10792
10410
2014
10240
10383
10400
9705
9740
9460
9637
9616
9255
8964
9060
8718
2015
8962
8663
8538
8521
8655
8251
8235
8017
7877
7869
7939
7927
2016
7829
7845
7977
7910
7451
7799
7749
7853
7904
7740
7409
7529
2017
7635
7528
7202
7056
6861
6977
6981
7132
6801
6520
6610
U-3 Unemployment Rate
4.1%
Series Id:           LNS14000000
Seasonally Adjusted
Series title:        (Seas) Unemployment Rate
Labor force status:  Unemployment rate
Type of data:        Percent or rate
Age:                 16 years and over
Download:
Year
Jan
Feb
Mar
Apr
May
Jun
Jul
Aug
Sep
Oct
Nov
Dec
Annual
2000
4.0
4.1
4.0
3.8
4.0
4.0
4.0
4.1
3.9
3.9
3.9
3.9
2001
4.2
4.2
4.3
4.4
4.3
4.5
4.6
4.9
5.0
5.3
5.5
5.7
2002
5.7
5.7
5.7
5.9
5.8
5.8
5.8
5.7
5.7
5.7
5.9
6.0
2003
5.8
5.9
5.9
6.0
6.1
6.3
6.2
6.1
6.1
6.0
5.8
5.7
2004
5.7
5.6
5.8
5.6
5.6
5.6
5.5
5.4
5.4
5.5
5.4
5.4
2005
5.3
5.4
5.2
5.2
5.1
5.0
5.0
4.9
5.0
5.0
5.0
4.9
2006
4.7
4.8
4.7
4.7
4.6
4.6
4.7
4.7
4.5
4.4
4.5
4.4
2007
4.6
4.5
4.4
4.5
4.4
4.6
4.7
4.6
4.7
4.7
4.7
5.0
2008
5.0
4.9
5.1
5.0
5.4
5.6
5.8
6.1
6.1
6.5
6.8
7.3
2009
7.8
8.3
8.7
9.0
9.4
9.5
9.5
9.6
9.8
10.0
9.9
9.9
2010
9.8
9.8
9.9
9.9
9.6
9.4
9.4
9.5
9.5
9.4
9.8
9.3
2011
9.1
9.0
9.0
9.1
9.0
9.1
9.0
9.0
9.0
8.8
8.6
8.5
2012
8.3
8.3
8.2
8.2
8.2
8.2
8.2
8.1
7.8
7.8
7.7
7.9
2013
8.0
7.7
7.5
7.6
7.5
7.5
7.3
7.3
7.2
7.2
6.9
6.7
2014
6.6
6.7
6.7
6.2
6.3
6.1
6.2
6.2
5.9
5.7
5.8
5.6
2015
5.7
5.5
5.4
5.4
5.5
5.3
5.2
5.1
5.0
5.0
5.0
5.0
2016
4.9
4.9
5.0
5.0
4.7
4.9
4.9
4.9
4.9
4.8
4.6
4.7
2017
4.8
4.7
4.5
4.4
4.3
4.4
4.3
4.4
4.2
4.1
4.1
U-3
U-6 Unemployment Rate
8.0%
Series Id:           LNS13327709
Seasonally Adjusted
Series title:        (seas) Total unemployed, plus all marginally attached workers plus total employed part time for economic reasons, as a percent of all civilian labor force plus all marginally attached workers
Labor force status:  Aggregated totals unemployed
Type of data:        Percent or rate
Age:                 16 years and over
Percent/rates:       Unemployed and mrg attached and pt for econ reas as percent of labor force plus marg attached
Download:
Year
Jan
Feb
Mar
Apr
May
Jun
Jul
Aug
Sep
Oct
Nov
Dec
Annual
2000
7.1
7.2
7.1
6.9
7.1
7.0
7.0
7.1
7.0
6.8
7.1
6.9
2001
7.3
7.4
7.3
7.4
7.5
7.9
7.8
8.1
8.7
9.3
9.4
9.6
2002
9.5
9.5
9.4
9.7
9.5
9.5
9.6
9.6
9.6
9.6
9.7
9.8
2003
10.0
10.2
10.0
10.2
10.1
10.3
10.3
10.1
10.4
10.2
10.0
9.8
2004
9.9
9.7
10.0
9.6
9.6
9.5
9.5
9.4
9.4
9.7
9.4
9.2
2005
9.3
9.3
9.1
8.9
8.9
9.0
8.8
8.9
9.0
8.7
8.7
8.6
2006
8.4
8.4
8.2
8.1
8.2
8.4
8.5
8.4
8.0
8.2
8.1
7.9
2007
8.4
8.2
8.0
8.2
8.2
8.3
8.4
8.4
8.4
8.4
8.4
8.8
2008
9.2
9.0
9.1
9.2
9.7
10.1
10.5
10.8
11.0
11.8
12.6
13.6
2009
14.2
15.2
15.8
15.9
16.5
16.5
16.4
16.7
16.7
17.1
17.1
17.1
2010
16.7
17.0
17.1
17.1
16.6
16.4
16.4
16.5
16.8
16.6
16.9
16.6
2011
16.2
16.0
15.9
16.1
15.8
16.1
15.9
16.1
16.4
15.8
15.5
15.2
2012
15.2
15.0
14.5
14.6
14.7
14.8
14.8
14.6
14.8
14.4
14.4
14.4
2013
14.5
14.4
13.8
14.0
13.8
14.2
13.8
13.6
13.7
13.6
13.1
13.1
2014
12.7
12.6
12.6
12.3
12.1
12.0
12.2
12.0
11.8
11.5
11.4
11.2
2015
11.3
11.0
10.9
10.8
10.7
10.5
10.3
10.2
10.0
9.8
9.9
9.9
2016
9.9
9.8
9.8
9.7
9.7
9.6
9.7
9.7
9.7
9.5
9.3
9.2
2017
9.4
9.2
8.9
8.6
8.4
8.6
8.6
8.6
8.3
7.9
8.0
Employment Situation Summary
Transmission of material in this release is embargoed until USDL-17-1616
8:30 a.m. (EST) Friday, December 8, 2017
Technical information:
Household data: (202) 691-6378 * cpsinfo@bls.gov * www.bls.gov/cps
Establishment data: (202) 691-6555 * cesinfo@bls.gov * www.bls.gov/ces
Media contact: (202) 691-5902 * PressOffice@bls.gov
THE EMPLOYMENT SITUATION -- NOVEMBER 2017
Total nonfarm payroll employment increased by 228,000 in November, and the unemployment
rate was unchanged at 4.1 percent, the U.S. Bureau of Labor Statistics reported today.
Employment continued to trend up in professional and business services, manufacturing,
and health care.
Household Survey Data
The unemployment rate held at 4.1 percent in November, and the number of unemployed
persons was essentially unchanged at 6.6 million. Over the year, the unemployment rate
and the number of unemployed persons were down by 0.5 percentage point and 799,000,
respectively. (See table A-1.)
Among the major worker groups, the unemployment rate for teenagers increased to 15.9
percent in November. The jobless rates for adult men (3.7 percent), adult women (3.7
percent), Whites (3.6 percent), Blacks (7.3 percent), Asians (3.0 percent), and Hispanics
(4.7 percent) showed little change. (See tables A-1, A-2, and A-3.)
The number of long-term unemployed (those jobless for 27 weeks or more) was essentially
unchanged at 1.6 million in November and accounted for 23.8 percent of the unemployed.
Over the year, the number of long-term unemployed was down by 275,000. (See table A-12.)
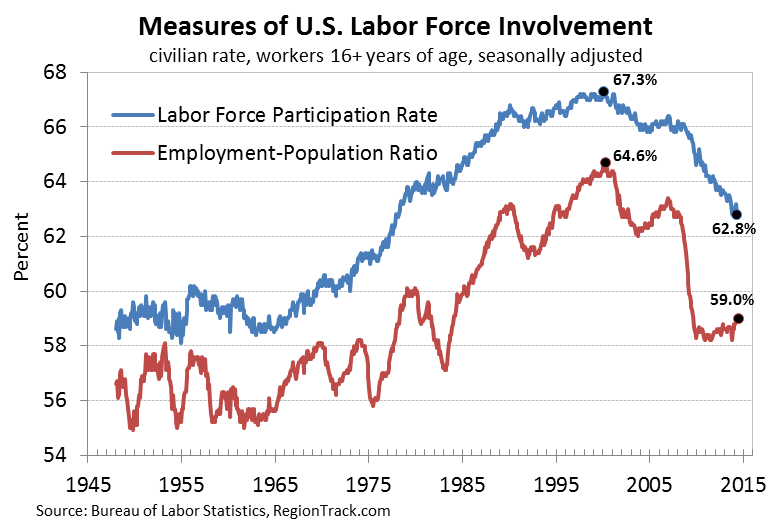
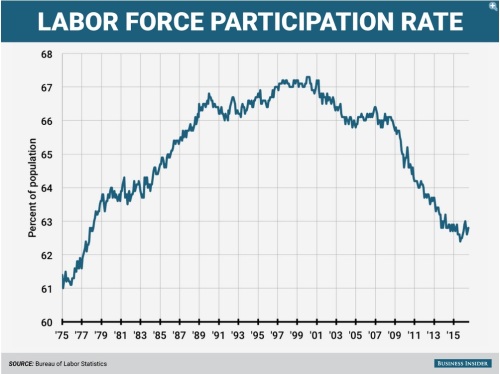
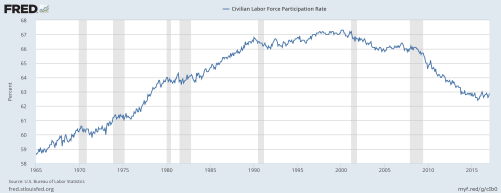
The labor force participation rate remained at 62.7 percent in November and has shown no
clear trend over the past 12 months. The employment-population ratio, at 60.1 percent,
changed little in November and has shown little movement, on net, since early this year.
(See table A-1.)
The number of persons employed part time for economic reasons (sometimes referred to as
involuntary part-time workers), at 4.8 million, was essentially unchanged in November but
was down by 858,000 over the year. These individuals, who would have preferred full-time
employment, were working part time because their hours had been cut back or because they
were unable to find full-time jobs. (See table A-8.)
In November, 1.5 million persons were marginally attached to the labor force, down by
451,000 from a year earlier. (The data are not seasonally adjusted.) These individuals
were not in the labor force, wanted and were available for work, and had looked for a job
sometime in the prior 12 months. They were not counted as unemployed because they had not
searched for work in the 4 weeks preceding the survey. (See table A-16.)
Among the marginally attached, there were 469,000 discouraged workers in November, down by
122,000 from a year earlier. (The data are not seasonally adjusted.) Discouraged workers
are persons not currently looking for work because they believe no jobs are available for
them. The remaining 1.0 million persons marginally attached to the labor force in November
had not searched for work for reasons such as school attendance or family responsibilities.
(See table A-16.)
Establishment Survey Data
Total nonfarm payroll employment increased by 228,000 in November. Employment continued to
trend up in professional and business services, manufacturing, and health care. Employment
growth has averaged 174,000 per month thus far this year, compared with an average monthly
gain of 187,000 in 2016. (See table B-1.)
Employment in professional and business services continued on an upward trend in November
(+46,000). Over the past 12 months, the industry has added 548,000 jobs.
In November, manufacturing added 31,000 jobs. Within the industry, employment rose in
machinery (+8,000), fabricated metal products (+7,000), computer and electronic products
(+4,000), and plastics and rubber products (+4,000). Since a recent low in November 2016,
manufacturing employment has increased by 189,000.
Health care added 30,000 jobs in November. Most of the gain occurred in ambulatory health
care services (+25,000), which includes offices of physicians and outpatient care centers.
Monthly employment growth in health care has averaged 24,000 thus far in 2017, compared
with an average increase of 32,000 per month in 2016.
Within construction, employment among specialty trade contractors increased by 23,000 in
November and by 132,000 over the year.
Employment in other major industries, including mining, wholesale trade, retail trade,
transportation and warehousing, information, financial activities, leisure and hospitality,
and government, changed little over the month.
The average workweek for all employees on private nonfarm payrolls increased by 0.1 hour
to 34.5 hours in November. In manufacturing, the workweek was unchanged at 40.9 hours, and
overtime remained at 3.5 hours. The average workweek for production and nonsupervisory
employees on private nonfarm payrolls was unchanged at 33.7 hours. (See tables B-2 and
B-7.)
In November, average hourly earnings for all employees on private nonfarm payrolls rose
by 5 cents to $26.55. Over the year, average hourly earnings have risen by 64 cents, or
2.5 percent. Average hourly earnings of private-sector production and nonsupervisory
employees rose by 5 cents to $22.24 in November. (See tables B-3 and B-8.)
The change in total nonfarm payroll employment for September was revised up from +18,000
to +38,000, and the change for October was revised down from +261,000 to +244,000. With
these revisions, employment gains in September and October combined were 3,000 more than
previously reported. (Monthly revisions result from additional reports received from
businesses and government agencies since the last published estimates and from the
recalculation of seasonal factors.) After revisions, job gains have averaged 170,000 over
the last 3 months.
_____________
The Employment Situation for December is scheduled to be released on Friday, January 5,
2018, at 8:30 a.m. (EST).
______________________________________________________________________________________
| |
| Revision of Seasonally Adjusted Household Survey Data |
| |
| In accordance with usual practice, The Employment Situation news release for December|
| 2017, scheduled for January 5, 2018, will incorporate annual revisions in seasonally |
| adjusted household survey data. Seasonally adjusted data for the most recent 5 |
| years are subject to revision. |
|______________________________________________________________________________________|
______________________________________________________________________________________
| |
| Conversion to the 2017 North American Industry Classification System |
| |
| With the release of January 2018 data on February 2, 2018, the establishment survey |
| will revise the basis for industry classification from the 2012 North American |
| Industry Classification System (NAICS) to 2017 NAICS. The conversion to 2017 NAICS |
| will result in minor revisions reflecting content changes within the mining and |
| logging, retail trade, information, financial activities, and professional and |
| business services sectors. Additionally, some smaller industries will be combined |
| within the mining and logging, durable goods manufacturing, retail trade, and |
| information sectors. Several industry titles and descriptions also will be updated. |
| |
| Approximately 4 percent of employment will be reclassified into different industries |
| as a result of the revision. Details of new, discontinued, and combined industries |
| due to the 2017 NAICS update, as well as changes due to the annual benchmarking |
| process, will be available on January 5, 2018. |
| |
| For more information on the 2017 NAICS update, visit www.census.gov/eos/www/naics/. |
|______________________________________________________________________________________|
Employment Situation Summary Table A. Household data, seasonally adjusted
HOUSEHOLD DATA
Summary table A. Household data, seasonally adjusted[Numbers in thousands]
Category
Nov.
2016
Sept.
2017
Oct.
2017
Nov.
2017
Change from:
Oct.
2017-
Nov.
2017
Employment status
Civilian noninstitutional population
254,540
255,562
255,766
255,949
183
Civilian labor force
159,456
161,146
160,381
160,529
148
Participation rate
62.6
63.1
62.7
62.7
0.0
Employed
152,048
154,345
153,861
153,918
57
Employment-population ratio
59.7
60.4
60.2
60.1
-0.1
Unemployed
7,409
6,801
6,520
6,610
90
Unemployment rate
4.6
4.2
4.1
4.1
0.0
Not in labor force
95,084
94,417
95,385
95,420
35
Unemployment rates
Total, 16 years and over
4.6
4.2
4.1
4.1
0.0
Adult men (20 years and over)
4.3
3.9
3.8
3.7
-0.1
Adult women (20 years and over)
4.2
3.9
3.6
3.7
0.1
Teenagers (16 to 19 years)
15.2
12.9
13.7
15.9
2.2
White
4.2
3.7
3.5
3.6
0.1
Black or African American
8.0
7.0
7.5
7.3
-0.2
Asian
3.0
3.7
3.1
3.0
-0.1
Hispanic or Latino ethnicity
5.7
5.1
4.8
4.7
-0.1
Total, 25 years and over
3.9
3.5
3.3
3.3
0.0
Less than a high school diploma
7.9
6.5
5.7
5.2
-0.5
High school graduates, no college
4.9
4.3
4.3
4.3
0.0
Some college or associate degree
3.9
3.6
3.7
3.6
-0.1
Bachelor’s degree and higher
2.3
2.3
2.0
2.1
0.1
Reason for unemployment
Job losers and persons who completed temporary jobs
3,542
3,359
3,227
3,159
-68
Job leavers
934
738
742
751
9
Reentrants
2,266
2,079
2,006
2,029
23
New entrants
728
669
629
691
62
Duration of unemployment
Less than 5 weeks
2,415
2,226
2,129
2,250
121
5 to 14 weeks
2,133
1,874
1,942
1,878
-64
15 to 26 weeks
1,073
963
853
927
74
27 weeks and over
1,856
1,733
1,621
1,581
-40
Employed persons at work part time
Part time for economic reasons
5,659
5,122
4,753
4,801
48
Slack work or business conditions
3,485
3,121
2,952
2,983
31
Could only find part-time work
1,902
1,733
1,629
1,559
-70
Part time for noneconomic reasons
21,059
21,011
20,923
21,018
95
Persons not in the labor force (not seasonally adjusted)
Marginally attached to the labor force
1,932
1,569
1,535
1,481
–
Discouraged workers
591
421
524
469
–
– Over-the-month changes are not displayed for not seasonally adjusted data.
NOTE: Persons whose ethnicity is identified as Hispanic or Latino may be of any race. Detail for the seasonally adjusted data shown in this table will not necessarily add to totals because of the independent seasonal adjustment of the various series. Updated population controls are introduced annually with the release of January data.
Employment Situation Summary Table B. Establishment data, seasonally adjusted
ESTABLISHMENT DATA
Summary table B. Establishment data, seasonally adjusted
Footnotes (1) Includes other industries, not shown separately. (2) Data relate to production employees in mining and logging and manufacturing, construction employees in construction, and nonsupervisory employees in the service-providing industries. (3) The indexes of aggregate weekly hours are calculated by dividing the current month’s estimates of aggregate hours by the corresponding annual average aggregate hours. (4) The indexes of aggregate weekly payrolls are calculated by dividing the current month’s estimates of aggregate weekly payrolls by the corresponding annual average aggregate weekly payrolls. (5) Figures are the percent of industries with employment increasing plus one-half of the industries with unchanged employment, where 50 percent indicates an equal balance between industries with increasing and decreasing employment. (P) Preliminary
NOTE: Data have been revised to reflect March 2016 benchmark levels and updated seasonal adjustment factors.
Story 2: Corporate Tax Cut Bill Will Pass By December 22, 2017 — Definitively Not Fundamental Tax Reform For The Middle Class — Replace Income Tax System with A Single Broad Based Consumption Tax Replacing All Federal Income Based Taxes — Videos —
CBS News poll: Most Americans don’t think GOP tax bill helps middle class
Republican tax reform focuses on the corporate side. Is it a mistake?
Rand Paul STRONGLY Supports Donald Trump’s Tax Plan | Tax Update
Rand Paul Supports Donald Trump’s Tax Bill
Rand Paul on BRILLIANT Strategy Obamacare Repeal and Tax Reform in Same Bill
Republicans losing the PR battle over tax reform?
Ex-OMB Director Stockman on Tax Reform, Russia
Corporate tax rate could be sticking point in tax reform fight
Trump aims for tax reform to get done in time for Christmas
Tax reform: Is SALT still on the table?
GOP tax plan is a corporate tax cut, not reform: Robert Wolf
State, local tax deductions should be eliminated: Laffer
NY Congressman: Eliminating SALT deductions are a ‘non-issue’
New Jersey Congressmen Push for SALT Deduction
Gary Cohn: GOP working to accommodate SALT states in tax reform
How the tax reform plans will impact your wallet
Milton Friedman – Why Tax Reform Is Impossible
Milton Friedman – Is tax reform possible?
Freedom from the IRS! – FairTax Explained in Detail
Pence on the Fair Tax
FairTax: Fire Up Our Economic Engine (Official HD)
Precision sacrificed for speed as GOP rushes ahead on taxes
5 tax issues Republicans need to resolve in conference
Now that the Senate and the House have passed two tax bills, there are some crucial differences they need to resolve in conference.(Video: Jenny Starrs/Photo: Melina Mara/The Washington Post)
Republicans are moving their tax plan toward final passage at stunning speed, blowing past Democrats before they’ve had time to fully mobilize against it but leaving the measure vulnerable to the types of expensive problems popping up in their massive and complex plan.Questionable special-interest provisions have been stuffed in along the way, out of public view and in some cases literally in the dead of night. Drafting errors by exhausted staff are cropping up and need fixes, which must be tackled by congressional negotiators working to reconcile competing versions of the legislation passed separately by the House and the Senate.And the melding process underway has opened the door to another frenzy of 11th-hour lobbying as special interests, including President Trump’s rich friends, make one last dash for cash before the final bill speeds through both chambers of Congress and onto Trump’s desk. Passage is expected the week before Christmas.
Economy & Business Alerts
Breaking news about economic and business issues.
Veterans of congressional tax overhauls, particularly the seminal revamp under President Ronald Reagan in 1986, have been stunned and in some cases outraged at how swiftly Republicans are moving on legislation that touches every corner of the economy and all Americans. And although GOP leaders make no apologies, some in their rank and file say that the process would have benefited from a more deliberate and open approach.
“I think it would have looked better if we had taken more time and had more transparency, had more open committee hearings,” said freshman Rep. James Comer (R-Ky.).
“Having said that, the goal that everybody had was to reduce the tax rates. . . . So at the end of the day the goal is going to be achieved, but we could have done it in a more transparent manner that probably would have given the voters that are being polled a little more confidence,” Comer said, referring to the effort’s poor showing in opinion surveys.
It has been a little more than a month since the $1.5 trillion legislation was introduced in the House, and in that short time it has cleared the two key committees in the House and Senate and won approval on the floors of both chambers, all without a single Democratic vote. If Trump signs the bill as planned before Christmas, that would mean a journey of less than two months between introduction and final passage.
The specific legislation that probably will become law, sold as a middle-class tax cut but featuring a massive corporate rate reduction at its center, is moving from release toward passage without any hearings, unusual for a bill of such magnitude. And as it tumbled along it picked up some startling new features, to the surprise of affected industries, Democrats and in some cases Republicans themselves.
Some of the most notable changes came in the hours before the Senate’s passage of its version of the plan, which happened about 1:50 a.m. Dec. 2.
The final vote was preceded by hours of inaction as Republicans fine-tuned their legislation behind closed doors, while fuming Democratic staffers ate Chinese food and pored over versions of the bill and lists of amendments that had been leaked by lobbyists on K Street before Republicans had made anything public.
As they got additional drafts of the bill, Democrats were incensed at some of what they found, including new breaks for the oil and gas industry, and a provision that appeared aimed specifically at helping Hillsdale College, a small liberal arts college in Michigan that doesn’t accept federal funding and has a large endowment funded by wealthy conservatives — including the family of Education Secretary Betsy DeVos.
An angry Sen. Bernie Sanders (I-Vt.) stood on his chamber’s floor to declare that “the federal treasury is being looted.” In their one victory of the debate, Democrats offered an amendment to strike the Hillsdale provision, and with the help of four Republicans it passed.
Democrats weren’t the only ones surprised by what was in the bill. Republicans and the business community were stunned when the final Senate version restored the alternative minimum tax for corporations. The tax, aimed at keeping companies from shirking their tax duties entirely, had been repealed in the House bill and earlier versions of the Senate measure.
Restoring the corporate alternative minimum tax created $40 billion in revenue for the bill, which helped Republicans come in under complex budgetary guidelines saying the legislation can’t go over the $1.5 trillion the GOP has agreed to add to the deficit over the next decade. Still, some Republicans professed not to know how the change had come about.
And under the new tax code the GOP bill would create, including the alternative minimum tax could have the unintended consequence of preventing companies from using other deductions, including the popular research and development tax credit.
“I’m guessing they just needed something quick to make the bill work,” said Rep. Devin Nunes (R-Calif.), who is one of the conferees charged with blending the two bills together.
Now, as quickly as it reappeared, the corporate alternative minimum tax probably will disappear again. Republican lawmakers widely agree that it doesn’t work and can’t be included, but it remains a mystery where they’ll find revenue to offset that change and pay for others they’re looking to include in the final package.
There has been discussion of moving the corporate rate — slashed from 35 percent to 20 percent by the House and Senate — back up to 22 percent, but the backlash against that proposal has been intense and it probably will be dropped. But revenue must be found somewhere because there are some changes that look nearly certain, including adjusting the new limit on deducting state and local taxes. Both the House and Senate legislation would allow taxpayers to deduct only up to $10,000 in property taxes. Some of Trump’s New York friends have taken exception to that provision and have lobbied the president personally against it.
It’s all part of a breakneck pace of the tax plan that contrasts with the nearly a year-and-a-half that passed between when Reagan unveiled his initial version of the 1986 tax plan and its ultimate passage into law. The less far-ranging tax cuts that President George W. Bush signed in 2001 took four months to become law after the release of Bush’s initial blueprint. And the Affordable Care Act took nearly a year to complete, including a congressional summer recess featuring angry town hall meetings that turned public sentiment sharply against the bill.
Democrats accuse Republicans of whisking the legislation along to avoid extended public scrutiny and prevent them from mounting an offensive at public hearings or over lengthy congressional breaks. The GOP bills have endured neither.
“It’s clear that we could have defeated this bill had we gone through regular order and had any expert witness from any blue state or high-tax state come in,” said Rep. John B. Larson (Conn.), who was a member of Democratic leadership during the much lengthier and more open process of passing the ACA. The provision limiting taxpayers’ ability to deduct state and local taxes hits high-tax areas such as California, New York, New Jersey and Connecticut particularly hard.
“People would have said, ‘Well, wait a minute,’ ” Larson said.
Republican congressional leaders dispute such comparisons, saying that the process on taxes has been going on for years, given that the party has long been debating the idea and an early foundational bill was released by then-Rep. Dave Camp (R-Mich.), former chairman of the tax-writing Ways and Means Committee, nearly four years ago. House Republicans, led by Speaker Paul D. Ryan (Wis.), also campaigned last year on an agenda called “A Better Way,” which featured a tax plank similar in many respects to the bill the House ultimately passed, although it drew scant attention at the time.
“These are relatively small bills, 400 pages or so; they’re not hard to digest. The policy decisions, the thoughtfulness, a lot of these issues we’ve been debating together and apart for years,” said House Ways and Means Chairman Kevin Brady (R-Tex.). “Bottom line is the American people have been waiting 30 years. So to paraphrase a hardware store: less talking, more doing.”
Even before the late-night Senate dramatics, the process offered surprises and sudden twists.
A provision repealing an Affordable Care Act requirement for most Americans to carry insurance or pay fines was added to the Senate bill with little warning over the course of an afternoon, a major health policy decision that is projected to leave 13 million more Americans uninsured in a decade but that would give Republicans $330 billion to pay for other things they want to do.
And the release of the House bill stunned manufacturers when they discovered it contained an “excise tax” on purchases from American companies’ foreign subsidiaries that some said could drive them out of business. The provision was watered down before passage by the Ways and Means Committee, but companies are still fighting to keep it out of the final bill, said Nancy McLernon, president of the Organization for International Investment, which represents global companies with U.S. operations. Despite the years-long focus on tax overhaul, such a provision had not been debated — even after companies beat back a different import tax, she said.
The Senate has a different provision that companies like better, but as far as the cost of going from one to the other or how it will all shake out, “It’s all a Rubik’s cube,” McLernon said.
Many lobbyists, Democrats and other observers expect to find the final version of the plan, which could be filed late this week, just as full of surprises as the various iterations that have appeared. But as they gun for a legislative win that has eluded them this year, Republicans show little interest in slowing down to take a closer look.
“The frenzy, and I would call it a frenzy, to get it done and have a Christmas present for America — number one, I think it’s unnecessary; it’s a self-imposed deadline, and number two, it makes the possibility for error much greater,” said Steve Bell, a senior adviser at the Bipartisan Policy Center who was staff director of the Senate Budget Committee during the 1986 tax effort. “This is a rush without a reason other than the political desire for a Rose Garden signing ceremony.”
The Taxman Cometh: Senate Bill’s Marginal Rates Could Top 100% for Some
Certain high-income business owners would face backwards incentives; lawmakers work to bridge gap
House and Senate Republicans are trying to reconcile their tax bills to get rid of the most contentious proposals.PHOTO: DANIEL ACKER/BLOOMBERG NEWS
By Richard Rubin
WASHINGTON—Some high-income business owners could face marginal tax rates exceeding 100% under the Senate’s tax bill, far beyond the listed rates in the Republican plan.
That means a business owner’s next $100 in earnings, under certain circumstances, would require paying more than $100 in additional federal and state taxes.
As lawmakers rush to write the final tax bill over the next week, they already are looking at changes to prevent this from happening. Broadly, House and Senate Republicans are trying to reconcile their bills, looking for ways to pay for eliminating the most contentious proposals. The formal House-Senate conference committee will meet on Wednesday, and GOP lawmakers may unveil an agreement by week’s end.
Talking Taxes: What’s Your Fair Share?
What do the 1% pay in taxes? Is it enough? Or too much? WSJ’s tax reporter Richard Rubin breaks it down with lots of candy. Video/Photo: Heather Seidel/The Wall Street Journal
The possible marginal tax rate of more than 100% results from the combination of tax policies designed to provide benefits to businesses and families but then deny them to the richest people. As income climbs and those breaks phase out, each dollar of income faces regular tax rates and a hidden marginal rate on top of that, in the form of vanishing tax breaks. That structure, if maintained in a final law, would create some of the disincentives to working and to earning business profit that Republicans have long complained about, while opening lucrative avenues for tax avoidance.
As a taxpayer’s income gets much higher and moves out of those phaseout ranges, the marginal tax rates would go down.
Consider, for example, a married, self-employed New Jersey lawyer with three children and earnings of about $615,000. Getting $100 more in business income would force the lawyer to pay $105.45 in federal and state taxes, according to calculations by the conservative-leaning Tax Foundation. That is more than double the marginal tax rate that household faces today.
If the New Jersey lawyer’s stay-at-home spouse wanted a job, the first $100 of the spouse’s wages would require $107.79 in taxes. And the tax rates for similarly situated residents of California and New York City would be even higher, the Tax Foundation found. Analyses by the Tax Policy Center, which is run by a former Obama administration official, find similar results, with federal marginal rates as high as 85%, and those don’t include items such as state taxes, self-employment taxes or the phase-out of child tax credits.
The bill as written would provide incentives for business owners to shift profit across calendar years, move personal expenses inside the business and engage in other economically unproductive maneuvers, said David Gamage, a tax-law professor at Indiana University.
“I would expect a huge tax-gaming response once people fully understand how it works,” said Mr. Gamage, a former Treasury Department official, who said business owners have an easier time engaging in such tax avoidance than salaried employees do. “The payoff for gaming is huge, within the set of people who both face these rates and have flexible enough business structures.”
The analyses “raise a valid concern” that lawmakers are examining, said Julia Lawless, a spokeswoman for the Senate Finance Committee.
“With any major reform, there will always be unusual hypotheticals delivering anomalous results,” she said. “The goal of Congress’s tax overhaul has been to lower taxes on the American people and by and large, according to a variety of analyses, we’re achieving that.”
Marginal tax rates are different from average tax rates. A marginal rate is the tax on the edge, or margin, of one’s earnings, and so it reflects what would be the next dollar of income. The average rate is a way of measuring a taxpayer’s total burden.
The Republican bills are trying to reduce both marginal and average tax rates, and for many taxpayers, they do. The marginal tax rates above 100% affect a small slice of households with very particular circumstances. Similar, though smaller, effects occur throughout the tax system.
“This is a big concern,” said Scott Greenberg, a Tax Foundation analyst. “It would be unfortunate if Congress passed a tax bill that had the effect of making additional work and additional income not worthwhile for any subgroup of households.”
Here’s how that New Jersey lawyer’s marginal rate adds up to more than 100%:
The household is paying the 35% marginal tax rate on their income range. Or, they are paying the alternative minimum tax, which operates at the same marginal rate in that income range.
The household is paying New Jersey’s highest income-tax rate, which is 8.97%, and now has to pay all of that because the Republican tax plan wouldn’t let such state or local taxes be deducted from federal income.
The household is also losing a deduction the Senate created for so-called pass-through businesses such as partnerships and S corporations. That 23% deduction is fully available to owners of service businesses like law firms, but only if income is below $500,000 for a married couple.
The deduction then phases out over $100,000 in income, according to a complex formula, disappearing entirely once income reaches $624,000. Up to that point, each additional dollar of business income faces progressively steeper tax rates because the deduction and its benefit are shrinking rapidly as income goes up.
The provisions also interact with each other in ways that drive up marginal rates. “The central problem here is that there is a large benefit phasing out over a short range,” Mr. Greenberg said.
The Republican bill doubles the child tax credit to $2,000 but phases it out beginning at $500,000 income for joint filers. The credit shrinks by $50 for every $1,000 in income above that, so a married couple with three children faces a higher marginal tax rate when they’re in that phase-out range.
The analysis assumes that the New Jersey lawyer is paying a 3.8% tax on self-employment income.
Pushing marginal rates lower on these households wouldn’t be easy and would require tradeoffs. Republicans could make the phaseout of the business deduction more gentle, spreading it over, say, $200,000, as opposed to $100,000, of income above $500,000. But that would make the tax cuts bigger, and Republicans are already looking for money to offset other changes they are planning.
They could lower the threshold for the child tax credit, but that would reduce tax cuts for households below $500,000.
Under current law, there are some high marginal tax rates for some lower-income households. Some families just above the poverty line can see their earned income tax credits and food stamps going down as their federal and state taxes go up. That combination can create marginal tax rates of around 75%, according to the Congressional Budget Office.
Appeared in the December 11, 2017, print edition as ‘Taxman Cometh: Marginal Rates Could Top 100% for Some.’
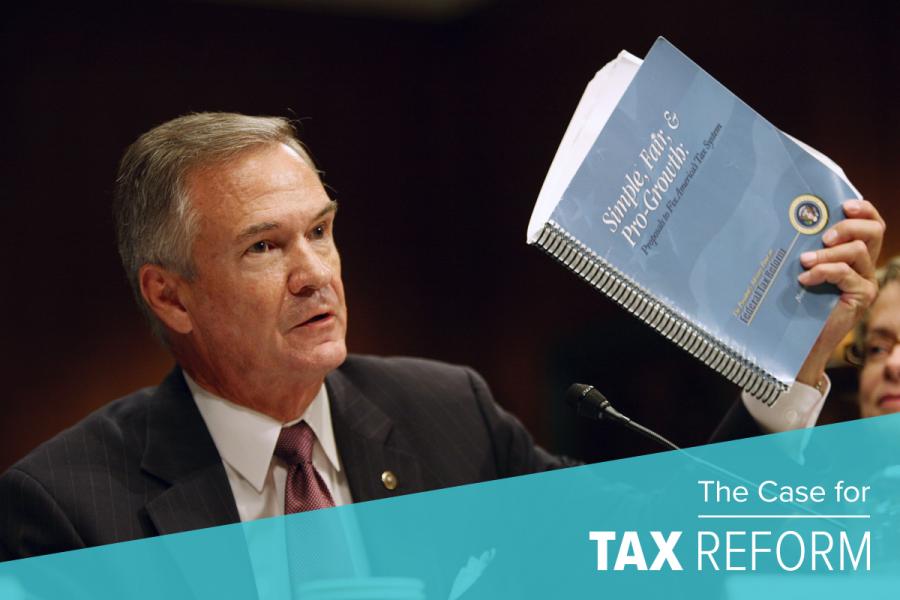
[This is part of an ongoing series entitled “The Case for Tax Reform,” which examines the importance of reforming the outdated tax code, and how achieving that goal will advance economic growth, jobs, and prosperity.]
Tax reform’s chances are better in this Congress than at any time in the past 30 years. Thus, comparisons come naturally to the events leading up to the 1986 Tax Reform Act (TRA86). These comparisons are useful for the similarities and the differences, both of which provide insights as to how to assure success today.
One important similarity is TRA86 brought to conclusion a long and detailed debate about tax policy. Our current efforts also rest on a lengthy debate recently brought to the fore. An important difference, however, is TRA86 was enacted as a widely accepted “should do,” whereas tax reform in 2017 is much more of a “must do.”
Two years later, in response to a poorly performing economy, Congress adopted the Steiger Amendment, significantly cutting the capital gains tax rate as part of the 1978 Revenue Act. While often ignored, the Steiger Amendment marked the bi-partisan recognition of tax policy’s importance for economic growth. Pro-growth tax reform was not just for tax geeks anymore.
Federal tax policy debate took on new energy in 1981 with the passage of the landmark Reagan tax cuts, dominated by substantial rate reduction. Following legislation in 1982 and 1984 to readjust tax levels, the stage was set for fundamental tax reform.
A bipartisan consensus regarding sound tax policy evolved through the years leading up to TRA86. This consensus distilled down to the simple mantra of “lower the rates, broaden the base.” Like the 1981 legislation, TRA86 would reduce tax rates substantially and install a less punitive system of capital consumption allowances. Unlike the 1981 legislation, however, the focus would also be on simplification, on the wide range of areas of the tax code reformed, and especially on revenue neutrality.
This consensus first took concrete form in two highly-detailed proposals out the Reagan Treasury Department, commonly dubbed Treasury I and its improved version, Treasury II, and released in 1984 and 1985 respectively. With these reports laying the groundwork, Congress then took over a year to legislate, finally producing TRA86.
The years between
TRA86 was the product of an extended period of consensus building and analysis. For those new to the debate, today’s strong momentum for comprehensive, pro-growth tax reform may seem to have arisen out of thin air, but, in fact, this debate has ebbed and flowed almost without pause since 1986.
The appetite for tax reform did not die following TRA86, and so consideration naturally moved on to the “next big thing.” For a period, the big thing seemed to be some kind of European-style Value Added Tax (VAT). The VAT momentum quickly petered out, however, and soon revenue pressures shifted the focus of tax policy once again to raising income tax rates, often with distinct “soak-the-rich” overtones. The VAT episode set tax reform’s pattern of ebb and flow for the following years.
Even as the debate toward TRA86 was underway, a very different approach to tax policy appeared in the Hall-Rabushka Flat Tax. Though the Flat Tax is best known for having a single rate of tax, hence the name, what really distinguishes the Flat Tax is its simplification, the elimination of all taxes on capital income and capital gains, and the adoption of a cash-flow tax on businesses centered on allowing capital purchases to be “expensed,” or deducted immediately.
In the 1990s, as the Flat Tax gained greater acceptance, tax reform topped the national agenda with Steve Forbes leading the charge. But this effort soon deflated along with Forbes’ 1996 presidential campaign.
Tax reform again gained traction briefly after the 2004 election with the release of the superb report of the presidential commission led by former Democratic Senator John Breaux and former Republican Senator Connie Mack. However, this effort, too, led to naught, a victim of competing priorities and a lack of consensus.
Income tax reform was pushed far onto the back burners during President Barack Obama’s tenure. Despite a historically weak economic recovery, the Obama administration expressed little interest in proposals to reduce the tax code’s drag on growth. The Obama administration contented itself with modest tweaks at the edges and otherwise dedicated its efforts to defending the status quo, especially in the area of international tax where global pressures were felt most profoundly.
Tax reform today
Even as years of inaction passed, pressure to reform the federal income tax code rose steadily from all sides. In part, this pressure arose because the U.S. economy was changing rapidly, and the tax code became an ever-worse fit for a modern economy.
In part, the pressure arose because even as America stood pat, America’s major trading partners did not. They were cutting business tax rates steadily and almost all were moving toward a territorial tax system to allow their businesses to compete more effectively in a global business climate of increasing intensity.
Though on the back burner, tax reform continued to simmer in backchannels. Then-House Budget Committee Chairman Paul Ryan (R-WI) advanced a series of thoughtful tax reform proposals as part of his broader efforts to reform Federal tax policy. Rep. Devin Nunes (R-CA) offered his variation on tax reform, differing from but along the same broad lines as the Ryan proposal. Sen. Marco Rubio (R-FL) also introduced a major, comprehensive tax reform proposal with his own interpretations, and then released subsequent iterations as comments and critiques soon followed. In these years, though President Obama continued to block tax reform’s path, the debate remained alive and well.
In 2014, former Ways and Means Committee Chairman David Camp (R-MI) introduced a detailed tax reform proposal. As tax reform would originate in this committee, Camp’s proposal took on greater significance than most. The Camp proposal was intended to serve as a prototype for tax legislation and so offered much more detail and, in some cases, specific options for resolving some of the nagging technical issues in adopting a territorial tax system, for example. However, in the face of President Obama’s determined disinterest, few were willing to contemplate seriously the hard choices the Camp plan laid out and so, again, tax reform was left to simmer on the back burner.
Tax reform played a limited role in the 2016 presidential campaign, with the Democratic nominee, Hillary Clinton, largely continuing the defense of the status quo established by President Obama. Meanwhile, the Republican nominee, Donald Trump, suggested a bold change of direction; though, he accompanied it by very few details. Trump’s election, combined with the strong Republican interest in tax reform, quickly moved the issue to the front burner.
The focus on growth
Tax reform today, like its 1986 predecessor, has a long history of debate, evolution, and refinement. TRA86 and the current effort also share an intense focus on improving economic growth, but with one important difference: TRA86 largely responded to a sense borne of the previous, deep recession that the economy needed to be both stronger and more resilient, and that sound tax policy could help. Tax reform was seen as something Congress and the president could and should accomplish.
Tax reform today shares a similar motivation, but with far greater urgency. Just as no business can compete for long if its cost structure substantially exceeds those of its competitors, American businesses cannot continue to compete effectively at home or abroad facing high tax rates, an inadequate capital cost recovery system, and an international tax system long abandoned by competing companies.
American companies are managing to compete successfully today but with ever greater difficulty under the federal tax system. Failure to reform the tax system would not result overnight in significant decline in Americans’ long-run economic prospects. But it would most assuredly do so over the next few years as both financial and human capital is driven overseas.
Tax reform is one task Congress and the president simply have to get right if America is to prosper.
[This is part of an ongoing series entitled “The Case for Tax Reform,” which examines the importance of reforming the outdated tax code, and how achieving that goal will advance economic growth, jobs, and prosperity.]
An underperforming economy and mounting international competition have propelled tax reform from topic of discussion to front-burner issue. There is no change in federal policy that offers greater potential to strengthen employment and increase wages for American workers than sound, comprehensive tax reform.
Reviewing and respecting the lessons from the last major tax reform over thirty years ago illuminates the road ahead, and provides lessons for how to raise our odds of success. Time provides a dimension worth exploring for similarities and contrasts between 1986 and today. Specifically, the time leading up to the effort, and the time needed for Congress to act.
The Historical On Ramp to Tax Reform
President John F. Kennedy understood the dampening economic effects of high tax rates. Though he died before seeing his program enacted, his successor, President Lyndon B. Johnson pushed the program through Congress and thus the 1964 tax bill is commonly referred to as the “Kennedy tax cuts.” The 1964 bill centered on significant tax rate reductions to achieve a substantially stronger economy.
Thereafter, budget pressures from the Vietnam War and Great Society programs reoriented tax policy once again toward ever-higher tax rates accompanied by a steady accretion of deductions and credits to blunt the effects of higher rates on politically favored constituencies. This process continued unabated into President Jimmy Carter’s administration and not surprisingly coinciding with a languishing economy.
Even as tax rates climbed and new distortions filled the tax code, a countermovement arose. In the final moments of the Ford Administration, Secretary William E. Simon released a landmark Treasury report directed by one of the era’s great economists, David Bradford, called “Blueprints for Basic Tax Reform,” guiding concepts of sound tax policy for years to come.
As the economy struggled and President Carter stood by, Congress took the initiative. With strong, bipartisan support over Carter’s objections, Congress substantially cut the capital gains tax rate as part of the 1978 Revenue Act, marking the first step in a change in tax philosophy culminating in the 1986 Tax Reform Act (TRA86).
Senator Bill Roth (R-DE) and Congressman Jack Kemp (R-NY) then picked up tax reform’s guidon, leading the charge for lower tax rates. At the same time, a second dimension in tax policy gained steam – the need for a less punitive capital cost recovery system. This debate was led largely outside Congress by the likes of Charls Walker and Ernie Christian, former Ford Administration Treasury hands, and Norman B. Ture, later Treasury undersecretary under Ronald Reagan.
Spurred by a recession wrought by a disinflationary monetary policy, the tax debate quickly came to a head in the 1981 “Reagan tax cuts.” The 1981 bill cut tax rates and instituted a vastly superior capital cost recovery system among other reforms. In the process, the bill cut revenues far more than Reagan proposed.
Though the 1981 bill was championed by a Republican president, it enjoyed widespread Democratic support. Rep. Dan Rostenkowski (D-IL), Chairman of the House Committee on Ways and Means introduced and pushed the legislation to passage, joined by almost half the House Democrats and almost a third of Senate Democrats.
The magnitude of the 1981 tax cuts proved politically unsustainable and were quickly followed by a series of tax hikes reversing some of the 1981 revenue reductions. Having settled the issue of how much to tax, the stage was now set for the 1986 reform and deciding who and how to tax.
Building Toward the 1986 Tax Reform Act
At about this time a fundamentally different approach to tax policy appeared: the Hall-Rabushka Flat Tax. The Flat Tax’s popularity often associates with the simplicity of imposing a single tax rate. However, the real revolution it offered was not the single tax rate,but what is subject to tax. Despite appearing as a traditional income tax, the Flat Tax was something quite new as it explicitly eliminated tax on investment income and imposed a simple cash flow tax on all businesses, thus adopting the principle of expensing, or allowing a full and immediate deduction for capital purchases.
The Flat Tax was too radical to gain wide acceptance in the early 1980s, but a vigorous bipartisan debate harkening back to Bradford’s 1976 “Blueprints” continued nonetheless. The 1981 tax cuts worked as intended to launch a powerful economic recovery, but memories of poor economic performance under Carter still lingered. A broad, bipartisan consensus championed faster economic growth by reforming the tax code to reduce the distortions to economic decision making it caused and the resulting misallocation of basic resources.
The basic strategy was to lower rates as in the 1981 Act, only further, and to implement a sound cost recovery system as in the 1981 Act. In contrast to 1981, however, the new strategy included a determined effort to “broaden the tax base” by eliminating distorting loopholes and tax credits, thereby intending the overall bill to be revenue neutral. .
The Treasury Department under Secretary Don Regan took the first big step in 1984 with the release of a densely packed 275 page proposal for comprehensive tax reform, dubbed “Treasury I”. While many aspects were well-received, as with most prototypes, Treasury I contained flaws, some of which Treasury addressed in 1985 with “Treasury II”.
Tax reform was off and running in Congress with the release of Treasury II, but the road was by no means easy. Time and again Reagan had to give Congress another not-always-gentle push. The greatest peril demanding Reagan’s firm hand came when Senate Finance Committee Chairman Bob Packwood (R-OR) realized he couldn’t pass tax reform on the path it was on. Ironically, the man who had repeatedly saved tax reform, President Reagan, was also now tax reform’s biggest obstacle.
The Price for Overcoming the Greatest Hurdle
Reagan was forced into pushing for the most rate reduction possible. Initially he drew the line at 25 percent for individuals and he held firm for much of the debate. Like most policy, tax reform involves trade-offs and Packwood just couldn’t find enough obvious base broadeners he could economically or politically trade off to hit a 25 percent rate.
Something had to give. At first the rate crept up to 26 and then to 28 percent. But at 28 percent, Reagan would go no further.
As Reagan urged Packwood to press on, Packwood had to get creative. He took fairly innocuous existing individual and corporate minimum taxes and expanded them into full-fledged parallel tax systems; voila, massive back-door base broadening. Packwood’s new Alternative Minimum Tax (AMT), while a superb example of terrible tax policy, had as its one redeeming feature: it raised enough money in a sufficiently confusing manner to hit the 28 percent rate without creating too many political problems, at least not for the duration of the debate. Three months later, the final bill passed the Senate.
Packwood’s AMT offers an important lesson for tax reform today. As important as low tax rates are for economic growth, policy makers and the public need to be honest about the tradeoffs involved. The broadest possible tax base capable of garnering sufficient political support can only raise so much revenue at a targeted tax rate. Demand an even lower tax rate and something (or someone) else will have to give and very likely pro-growth tax policy will suffer as a consequence.
Back to the Present
With respect to time, the current tax reform debate parallels that of 1986 closely. TRA86 concluded a lengthy, evolutionary process regarding accepted beliefs about sound, pro-growth tax policy. That process distilled to the lowest possible rates and applied to a simple, broad tax base, while allowing for a depreciation system for capital costs minimizing the anti-investment aspects of an income tax.
Tax reform today shares these traits, both with respect to the substance of reform – low rates, broad base, and today, expensing – and with respect to time. Like the 1986 episode, tax reform today reflects the product of many years of debate regarding the design of pro-growth tax policy, an evolution that began in 1986.
In one other critical respect regarding time, TRA86 and the current effort offer stark contrasts. Where the legislative starting gun on TRA86 went off in 1984 and the effort then proceeded for over two years, Congress in 2017 will have only a handful of months from introduction to tax reform’s final passage. This difference in time will have significant implications for how Congress defines “comprehensive” as they work toward pro-growth tax reform.
BAGHDAD – Hundreds of ISIS fighters had just been chased out of a northern Syrian city and were fleeing through the desert in long convoys, presenting an easy target to U.S. A-10 “warthogs.”
But the orders to bomb the black-clad jihadists never came, and the terrorists melted into their caliphate — living to fight another day. The events came in August 2016, even as then-Republican presidential nominee Donald Trump was vowing on the campaign trail to let generals in his administration crush the organization that, under President Obama, had grown from the “jayvee team” to the world’s most feared terrorist organization.
U.S. Air Force Brig. Gen. Andrew Croft said the Trump administration has put a strong leadership team in place (U.S. Army photo by Sgt. Tracy McKithern)
“I will…quickly and decisively bomb the hell out of ISIS,” Trump, who would name legendary Marine Corps Gen. James Mattis as secretary of defense, promised. “We will not have to listen to the politicians who are losing the war on terrorism.”
Just over a year later, ISIS has been routed from Iraq and Syria with an ease and speed that’s surprised even the men and women who carried out the mission. Experts say it’s a prime example of a campaign promise kept. President Trump scrapped his predecessor’s rules of engagement, which critics say hamstrung the military, and let battlefield decisions be made by the generals in the theater, and not bureaucrats in Washington.
“I felt quite liberated because we had a clear mandate and there was no questioning that.”
– U.S. Marine Col. Seth Folsom
At its peak, ISIS held land in Iraq and Syria that equaled the size of West Virginia, ruled over as many as 8 million people, controlled oilfields and refineries, agriculture, smuggling routes and vast arsenals. It ran a brutal, oppressive government, even printing its own currency.
Lt. Col. Seth Folsom credits the cooperation between Iraqi Security Forces and the U.S-led coalition for the military defeat of ISIS in Iraq. (Courtesy U.S Army)
ISIS remains a danger, as members who once ruled cities and villages like a quasi-government now live secretly among civilian populations in the region, in Europe and possibly in the U.S. These cells will likely present a terrorist threat for years. In addition, the terrorist organization is attempting to regroup in places such as the Philippines, Libya and the Sinai Peninsula.
But the military’s job — to take back the land ISIS claimed as its caliphate and liberate cities like Mosul, in Iraq, and Raqqa, in Syria, as well as countless smaller cities and villages, is largely done. And it has taken less than a year.
Mattis, a US Marine Corps general, said there would be no White House micromanaging on his watch (Associated Press)
“The leadership team that is in place right now has certainly enabled us to succeed,” Brig. Gen. Andrew Croft, the ranking U.S. Air Force officer in Iraq, told Fox News. “I couldn’t ask for a better leadership team to work for, to enable the military to do what it does best.”
“It moved more quickly than at least I had anticipated,” Croft said. “We and the Iraqi Security Forces were able to hunt down and target ISIS leadership, target their command and control.”
U.S. Marine Corps Brig. Gen. Robert Sofge said the military now has a clear mandate (U.S. Army photo by Spc. Cole Erickson)
After the battle to liberate Mosul – ISIS’ Iraqi headquarters – was completed in July — the U.S.-led coalition retook Tel Afar in August, Hawija in early October and Rawa in Anbar province in November.
Marine Col. Seth Folsom, who oversaw fighting in Al Qaim near the Syrian border, agreed. He wasn’t expecting his part of the campaign against ISIS to get going until next spring and figured even then, it would then “take six months or more.”
Instead, ISIS was routed in Al Qaim in just a few days.
Mosul, and several other cities liberated by ISIS, were largely destroyed in the fighting. (Fox News/Hollie McKay)
“We really had one mandate and that was enable the Iraqi Security Forces to defeat ISIS militarily here in Anbar. I feel that we have achieved that mission,” Folsom said. “I never felt constrained. In a lot of ways, I felt quite liberated because we had a clear mandate and there was no questioning that.”
Brig. Gen. Robert “G-Man” Sofge, the top U.S. Marine in Iraq, told Fox News his commanders have “enjoyed not having to deal with too many distractions and there was no question about what the mission here in Iraq was.”
Iraqi Brig. Gen. Yahya Rasool was skeptical of Trump at first, but says success on the ground has been swift (Fox News/Hollie McKay )
“We were able to focus on what our job was without distraction and I think that goes a long way in what we are trying to accomplish here,” he said.
Sofge said criticism that loosening rules of engagement put civilians at risk is “absolutely not true.”
Col. Ryan Dillon. Combined Joint Task Force – Inherent Resolve Spokesman (Photo by CJTFOIR)
“We used precision strikes, and completely in accordance with international standards,” he said. “We didn’t lower that standard, not one little bit. But we were able to exercise that precision capability without distraction and I think the results speak for themselves.”
The U.S.-led coalition said this week the Coalition Civilian Casualty Assessment Team has added 30 new staffers to travel throughout the region. It said military leaders continue to “hold themselves accountable for actions that may have caused unintentional injury or death to civilians.”
The coalition also said dozens of reports of civilian casualties have been determined to be “non-credible,” and just .35 percent of the almost 57,000 separate engagement carried out between August 2014 and October 2017 resulted in a credible report of a civilian casualty.
In addition to air support, the U.S.-led strategy also includes training and equipping Iraqi troops on the ground.
While the Trump administration’s success is often underplayed in the U.S. media, it is obvious on the ground in Iraq, according to a spokesman for Iraq’s Ministry of Defense, Yahya Rasool.
“I was not optimistic when Trump first came to the office,” Rasool said. “But after a while I started to see a new approach, the way the U.S. was dealing with arming and training. I saw how the coalition forces were all moving faster to help the Iraq side more than before. There seemed to be a lot of support, under Obama we did not get this.”
Al-Baghdadi, who once ruled a caliphate the size of California, is now inn hiding and likely badly injured
Despite the victories on the battlefield, U.S. officials cautioned much work remains to be done.
“ISIS is very adaptive,” noted Col. Ryan Dillon, the U.S.-led coalition spokesman. “We are already seeing smaller cells and pockets that take more of an insurgent guerrilla type approach as opposed to an Islamic army or conventional type force. So we have got to be prepared for that.”
He said as a result the coalition is “adjusting some training efforts” so the Iraqi forces — upwards of 150,000 have already undergone training — are equipped to address such threats and ensure long-term stability.
Folsom said “the worst thing we could do” is not finish the job.
“If a country becomes a failed state, if it becomes a lawless region, you begin to set the conditions for what happened in the years before 9/11,” he said. “In those ungoverned spaces where we don’t know what is going on, that is where those seeds of extremism begin to blossom.”
The Pronk Pops blog is the broadcasting and mass communication of ideas about life, liberty, and the pursuit of happiness, prosperity, truth, virtue and wisdom.


Leave a comment