Dr. Michael Berliner, co-chairman of the Board of Directors of the Ayn Rand Institute, former professor of philosophy and executive director of the Ayn Rand Institute, reminds us of the true meaning of Independence Day.
John Adams – Declaretion of Indipendence (HD – With subtitles)
President Underwood’s Speech – House of Cards Season 3
Frank Underwood Explains Why We Watch
Kevin Spacey Explains Who Frank Underwood Is Talking To
Q8 – Trump – cut entitlements, Social Security, deficit, deliver on promises? bringing back jobs
Milton Friedman – The Free Lunch Myth
2017 – The End of Social Security?
Milton Friedman – FDR and Social Security
Milton Friedman – The Social Security Myth
Milton Friedman – The Great Depression Myth
Milton Friedman: The Rise of Socialism is Absurd
Milton Friedman – Socialism is Force
TAKE IT TO THE LIMITS: Milton Friedman on Libertarianism
Milton Friedman: The Two Major Enemies of a Free Society
Milton Friedman – The Draft – From Compulsory to Voluntary
Milton Friedman – Should Higher Education Be Subsidized?
Thomas Sowell — Dismantling America
The Difference Between Liberal and Conservative
The Passing of The Declaration of Independence – John Adams – HBO
Understanding the Declaration of Independence – 9 Key Concepts Everyone Should Know
History of the 4th of July: Crash Course US History Special
Tea, Taxes, and The American Revolution: Crash Course World History #28
4th of July Zombies – Americans Don’t Know Why We Celebrate Fourth of July!
IN CONGRESS, JULY 4, 1776
The unanimous Declarationof the thirteen unitedStates of America
hen in the Course of human events it becomes necessary for one people to dissolve the political bands which have connected them with another and to assume among the powers of the earth, the separate and equal station to which the Laws of Nature and of Nature’s God entitle them, a decent respect to the opinions of mankind requires that they should declare the causes which impel them to the separation.
We hold these truths to be self-evident, that all men are created equal, that they are endowed by their Creator with certain unalienable Rights, that among these are Life, Liberty and the pursuit of Happiness. — That to secure these rights, Governments are instituted among Men, deriving their just powers from the consent of the governed, — That whenever any Form of Government becomes destructive of these ends, it is the Right of the People to alter or to abolish it, and to institute new Government, laying its foundation on such principles and organizing its powers in such form, as to them shall seem most likely to effect their Safety and Happiness. Prudence, indeed, will dictate that Governments long established should not be changed for light and transient causes; and accordingly all experience hath shewn that mankind are more disposed to suffer, while evils are sufferable than to right themselves by abolishing the forms to which they are accustomed. But when a long train of abuses and usurpations, pursuing invariably the same Object evinces a design to reduce them under absolute Despotism, it is their right, it is their duty, to throw off such Government, and to provide new Guards for their future security. — Such has been the patient sufferance of these Colonies; and such is now the necessity which constrains them to alter their former Systems of Government. The history of the present King of Great Britain is a history of repeated injuries and usurpations, all having in direct object the establishment of an absolute Tyranny over these States. To prove this, let Facts be submitted to a candid world.
He has refused his Assent to Laws, the most wholesome and necessary for the public good.
He has forbidden his Governors to pass Laws of immediate and pressing importance, unless suspended in their operation till his Assent should be obtained; and when so suspended, he has utterly neglected to attend to them.
He has refused to pass other Laws for the accommodation of large districts of people, unless those people would relinquish the right of Representation in the Legislature, a right inestimable to them and formidable to tyrants only.
He has called together legislative bodies at places unusual, uncomfortable, and distant from the depository of their Public Records, for the sole purpose of fatiguing them into compliance with his measures.
He has dissolved Representative Houses repeatedly, for opposing with manly firmness his invasions on the rights of the people.
He has refused for a long time, after such dissolutions, to cause others to be elected, whereby the Legislative Powers, incapable of Annihilation, have returned to the People at large for their exercise; the State remaining in the mean time exposed to all the dangers of invasion from without, and convulsions within.
He has endeavoured to prevent the population of these States; for that purpose obstructing the Laws for Naturalization of Foreigners; refusing to pass others to encourage their migrations hither, and raising the conditions of new Appropriations of Lands.
He has obstructed the Administration of Justice by refusing his Assent to Laws for establishing Judiciary Powers.
He has made Judges dependent on his Will alone for the tenure of their offices, and the amount and payment of their salaries.
He has erected a multitude of New Offices, and sent hither swarms of Officers to harass our people and eat out their substance.
He has kept among us, in times of peace, Standing Armies without the Consent of our legislatures.
He has affected to render the Military independent of and superior to the Civil Power.
He has combined with others to subject us to a jurisdiction foreign to our constitution, and unacknowledged by our laws; giving his Assent to their Acts of pretended Legislation:
For quartering large bodies of armed troops among us:
For protecting them, by a mock Trial from punishment for any Murders which they should commit on the Inhabitants of these States:
For cutting off our Trade with all parts of the world:
For imposing Taxes on us without our Consent:
For depriving us in many cases, of the benefit of Trial by Jury:
For transporting us beyond Seas to be tried for pretended offences:
For abolishing the free System of English Laws in a neighbouring Province, establishing therein an Arbitrary government, and enlarging its Boundaries so as to render it at once an example and fit instrument for introducing the same absolute rule into these Colonies
For taking away our Charters, abolishing our most valuable Laws and altering fundamentally the Forms of our Governments:
For suspending our own Legislatures, and declaring themselves invested with power to legislate for us in all cases whatsoever.
He has abdicated Government here, by declaring us out of his Protection and waging War against us.
He has plundered our seas, ravaged our coasts, burnt our towns, and destroyed the lives of our people.
He is at this time transporting large Armies of foreign Mercenaries to compleat the works of death, desolation, and tyranny, already begun with circumstances of Cruelty & Perfidy scarcely paralleled in the most barbarous ages, and totally unworthy the Head of a civilized nation.
He has constrained our fellow Citizens taken Captive on the high Seas to bear Arms against their Country, to become the executioners of their friends and Brethren, or to fall themselves by their Hands.
He has excited domestic insurrections amongst us, and has endeavoured to bring on the inhabitants of our frontiers, the merciless Indian Savages whose known rule of warfare, is an undistinguished destruction of all ages, sexes and conditions.
In every stage of these Oppressions We have Petitioned for Redress in the most humble terms: Our repeated Petitions have been answered only by repeated injury. A Prince, whose character is thus marked by every act which may define a Tyrant, is unfit to be the ruler of a free people.
Nor have We been wanting in attentions to our British brethren. We have warned them from time to time of attempts by their legislature to extend an unwarrantable jurisdiction over us. We have reminded them of the circumstances of our emigration and settlement here. We have appealed to their native justice and magnanimity, and we have conjured them by the ties of our common kindred to disavow these usurpations, which would inevitably interrupt our connections and correspondence. They too have been deaf to the voice of justice and of consanguinity. We must, therefore, acquiesce in the necessity, which denounces our Separation, and hold them, as we hold the rest of mankind, Enemies in War, in Peace Friends.
We, therefore, the Representatives of the united States of America, in General Congress, Assembled, appealing to the Supreme Judge of the world for the rectitude of our intentions, do, in the Name, and by Authority of the good People of these Colonies, solemnly publish and declare, That these united Colonies are, and of Right ought to be Free and Independent States, that they are Absolved from all Allegiance to the British Crown, and that all political connection between them and the State of Great Britain, is and ought to be totally dissolved; and that as Free and Independent States, they have full Power to levy War, conclude Peace, contract Alliances, establish Commerce, and to do all other Acts and Things which Independent States may of right do. — And for the support of this Declaration, with a firm reliance on the protection of Divine Providence, we mutually pledge to each other our Lives, our Fortunes, and our sacred Honor.
Steve Bannon is right: Donald Trump should raise taxes on the rich
Updated by Dylan Matthews Jul 3, 2017, 12:20pm EDT
White House chief strategist Steve Bannon has a big idea that, according to Axios, he’s been pushing aggressively within the Trump administration: raising the top income tax rate. He’s reportedly telling his colleagues that the top bracket should “have a 4 in front of it.” (The current top bracket is 39.6 percent, or 43.4 after you include Medicare taxes.)
This would be a big shift for the administration. Its latest tax plan would cut the top rate on non-investment income to 35 percent, or 37.9 percent including Medicare taxes. Earlier plans featured top rates of 33 percent and 25 percent, and would lower the rate for “pass-through” income that owners of certain businesses get from 39.6 percent to a mere 15 percent, inducing a huge amount of tax evasion and cutting average rates for the rich still further.
And while Bannon has always affected a rivalry with wealthy elites, which this latest proposal fits into well, it’s doubtful that the more traditional supply-side conservatives on Trump’s economic team, namely Treasury Secretary Steve Mnuchin and National Economic Council Chair Gary Cohn, will get on board.
But they should. Trump and his team have a tremendous number of goals for tax reform. They want a dramatically lower corporate tax rate (Axios reports that Mnuchin and Cohn “aren’t bluffing when they say they want to slash the corporate tax rate to 15% from the current 35%”) and to let companies deduct all their investments immediately, instead of over time. They want a much bigger standard deduction on the individual side, and some kind of subsidy for child care.
Those are expensive changes, which require substantial pay-fors. One of the biggest that Republicans have proposed is the hugely controversial border adjustment measure, which Walmart, the Koch brothers, and other influential business lobbies are loudly opposing. Another is ending the deductibility of interest for debt, a very worthwhile proposal that is sure to enrage banks that take out massive amounts of debt; Goldman Sachs veteran Mnuchin has said he opposes this shift. On the individual side, eliminating the state and local tax deduction, as the Trump team has proposed, would raise money and reduce a big giveaway to rich people in blue states, but then again, the category “rich people in blue states” includes a lot of GOP donors as well as Trump himself.
And even if all of those controversial changes made it through, they might not be enough to pay for all the cuts that Republicans want.
Giving up on individual income tax rate cuts, and embracing higher rates for top earners, would free up a lot more money for corporate tax cuts. The Congressional Budget Office estimates that raising the brackets for people making more than $400,000 or so by 1 point each would raise about $93 billion over 10 years. For a new top rate of, say, 47 percent, that could mean as much as $650 billion over 10 years, and even more if you’re willing to hit 50 percent or raise taxes on people making under $400,000. Another option would be to do what Hillary Clinton proposed in the campaign and add a 5 percent surcharge to income above a certain threshold, without any deductions allowed; that would further reduce opportunities for tax evasion.
An even more ambitious plan, proposed by economists Alan Viard and Eric Toder and embraced by Sen. Mike Lee (R-UT), would overhaul the way the US taxes investment income. Today profits are taxed through the corporate tax code, and then again when they’re distributed to investors through dividends, or when those investors sell shares for a capital gain. Viard and Toder propose lowering the corporate rate to 15 percent and then taxing investments every year at normal income tax rates, whether or not they’re sold. That would end preferential treatment for investment income in the individual code, and let the individual tax raise quite a bit more money. It would enable a 45 or 47 percent top bracket to raise even more revenue to offset the cost of full expensing and a bigger standard deduction.
Ultimately, the Trump administration has to make a decision about what its goal in tax reform is. If the goal is to cut corporate taxes and encourage investment by companies, then Bannon is right: Top income rates should go up to pay for that. If the goal is to just funnel money to rich people, then they shouldn’t. But the former is a more defensible goal, and a top income rate of 45 or 47 percent would help get us there.
Part 2 –Story 2: Majority of American People Want and Deserve A Big, Bold, Bipartisan Tax Reform Cut — The Time Is Now For The Fair Tax Less Version of The FairTax — Trump Should Embrace Real Tax Reform By Becoming Champion of Fair Tax Less If He Wants A Booming Economy Growing At 5% Plus — No Guts — No Glory — Just Do It By Labor Day September 4, 2017 — Make America Great Again — What Good is Dreaming It If You Don’t Actually Do It! — Videos
Trump vs. OECD on tax reform
Watters visits Trump’s alma mater to talk tax reform
Rep. Meadows: Tax reform, health care and infrastructure get done by September
Speaker Ryan Guarantees That Congress Will Get Tax Reform Done In 2017
Speaker Paul Ryan Full Speech on Tax Reform 6-20-17
Ron Paul on Paul Ryan’s tax reform plan
How Trump’s tax reform plan will impact the economy
Donald Trump: Simplify the Tax Code
Donald Trump: I pay as little as possible in taxes
Grover Norquist on Speaker Ryan’s tax reform timeline
Grover Norquist: Expect dramatic tax cuts from Trump
The Pledge: Grover Norquist’s hold on the GOP
FairTax: Fire Up Our Economic Engine (Official HD)
Pence on the Fair Tax
Freedom from the IRS! – FairTax Explained in Details
Millionaire confidence plunges on Trump’s tax reform delays
What’s Up With Trump’s Tax Reform? Myths vs. Facts
The FairTax: It’s Time
Dan Mitchell explains the fair tax
Six Reasons Why the Capital Gains Tax Should Be Abolished
Is America’s Tax System Fair?
Sen. Moran Discusses FairTax Legislation on U.S. Senate Floor
Milton Friedman – Why Tax Reform Is Impossible
Milton Friedman – Is tax reform possible?
What’s Killing the American Dream?
Robert Wolf: Border adjustment not going to happen
Is Donald Trump serious about tax reform?
Sean Spicer: Trump wants to get tax reform right
Will tax reform really happen by August?
Dan Mitchell Discussing GOP Tax Plan and Corporate Rate Reduction
What Tax Reform Could Look Like Under Donald Trump | Squawk Box | CNBC
#Eakinomics – 4 Key Questions on Dynamic Scoring
What is Dynamic Scoring?
Trump Pushes ‘Major Border Tax’ to Keep Jobs in U.S.
Ryan Unexpectedly Joins Forces With Bannon on Border Tax
Kudlow: Freedom Caucus & Trump’s base is opposed to Border Adjustment Tax
Sen. Perdue: Border Adjustment Tax would “shutdown economic growth”
Sen. Tom Cotton: “I have serious concerns” w/ Border Adjustment Tax
Americans Need a Progressive Consumption Tax
Sen. Strange: “I would not” vote for a Border Adjustment Tax
CNBC: Steve Forbes on Border Adjustment Tax – “Don’t Do It” 2.8.17
Meg Whitman: Border Adjustment Tax Will Not Create Jobs | CNBC
Art Laffer: Border tax is a major mistake
Border Tax Fight Is Economists Vs. Everybody Else | Squawk Box | CNBC
Dan Mitchell Discussing GOP Tax Plan and Corporate Rate Reduction
What is a Border Adjustment?
Border Tax: What You Need to Know
Will a border adjustment tax help American businesses?
Will a border adjustment tax kill free trade?
Border adjustment tax political suicide?
Fox Pol:l 73% Want Tax Reform This Year – Cavuto
Could the border tax debate stall tax reform?
Is A Border Adjustment Tax A Good Idea?
Border Adjustment Tax: Trump’s MAGA Ace
President Donald Trump Begins First Week By Meeting With Top Business Leaders | NBC News
Dan Mitchell Fretting about GOP Border-Adjustable Tax Plan
Making Sense Of The 20 Percent Tax Proposal | Morning Joe | MSNBC
Proposed Tax Package A Dramatic Cut Even With A Border Tax?
Treasury Secretary Steve Mnuchin On Tax Reform, Growth, Border Tax, China (Full) | Squawk Box | CNBC
Wilbur Ross On Border Tax: Something Will Be Found To Fill Trillion-Dollar Hole | Squawk Box | CNBC
Honda “Impossible Dream” Commercial
Honda Advert: Impossible Dream II 2010
Lyrics
To dream the impossible dream
To fight the unbeatable foe
To bear with unbearable sorrow
To run where the brave dare not go
To right the unrightable wrong
To love pure and chaste from afar
To try when your arms are too weary
To reach the unreachable star
This is my quest, to follow that star,
No matter how hopeless, no matter how far
To fight for the right without question or cause
To be willing to march into hell for a heavenly cause
And I know if I’ll only be true to this glorious quest
That my heart will lie peaceful and calm when I’m laid to my rest
And the world will be better for this
That one man scorned and covered with scars
Still strove with his last ounce of courage
To fight the unbeatable foe, to reach the unreachable star
Donald Trump is a man who throws down gauntlets, and he threw down several big ones during his campaign for president — confronting the status quos on immigration, onhealthcare and on taxes, to name a few. He is now pursuing bold policy changes on each. But it could be Trump’s action on taxes that matters most to whether the stock market continues to ride high, GDP growth returns to a healthy 3% and, therefore, whether his presidency is judged well in posterity.
News about taxes has been relatively slow thus far in Trump’s administration. Judicial blowback against his immigration policies and Congressional blowback on healthcare reform have received far more attention than the general tax-plan principles he announced in April. Still, achieving detailed tax reform may prove even more difficult than his other policy struggles once the wheels start turning.
Before making tax reform a year-end goal, Treasury Secretary Steven Mnuchin initially said he hoped to complete tax reform by August. Senate Majority Leader Mitch McConnell reacted by saying that tax reform is a “very complicated subject” and harder to do now than the last time Congress achieved it in 1986. And passing the 1986 tax reform legislation was no easy task — it required winning the support of a Democratic House and a Republican president, and took nearly two years of intense negotiations. Alluding more cynically to the significant political obstacles that often impede changing the tax code, former House Speaker John Boehner said the passing of a tax code overhaul is “just a bunch of happy talk.”
Now, however, current Speaker Paul Ryan is also pushing for tax reform by the end of 2017, making these obstacles appear a little less daunting than if the administration were going it alone.
Aside from whether tax experts and Washington politicians are willing to upend the tax code, it is important to note where the American people stand on the need for action on taxes. It must be remembered that taxpayers may dislike the current tax system but not be convinced that Congress and the Trump administration will make it any better — change could be worse. Without a strong push from the American people, Trump’s tax reform might not materialize.
During the 2016 presidential campaign, Gallup tested several of candidate Trump’s tax proposals.
He advocated eliminating most federal income tax deductions and loopholes for the very rich, and Gallup found 63% of American adults favoring this with just 17% opposed.
His proposal to simplify the federal tax code — reducing the current seven tax brackets to four — was also popular, with 47% agreeing and only 12% disagreeing.
Trump’s plan to eliminate the estate tax paid when someone dies garnered considerably more agreement than disagreement from Americans, 54% to 19%. Notably, this is an issue that Congress and the wider public have considered in the recent past, and public sentiment on the issue today is in line with past Gallup polls on this issue, such as when it asked about keeping the estate tax from increasing in 2010.
More recently, in March 2017, Americans viewed President Trump’s general plan to “significantly cut federal income taxes for the middle class” positively: 61% agreed with the plan (with no mention of Trump in the question), 26% disagreed and 13% had no opinion. Trump’s proposal to lower corporate tax rates, however, elicited a split decision, with 38% reacting positively, 43% negatively and the potentially decisive 19% “no opinion” group apparently needing more information.
These findings suggest Americans could respond favorably to many of the specific elements of Trump’s ultimate tax plan, provided they make it into whatever legislation Congress winds up debating. For example, in spite of closing tax loopholes that favor the rich, the plan is expected to end up cutting taxes on the wealthy, not raising them. But as long as the plan also cuts taxes on the middle class, that fact alone is unlikely to sink it with Americans. Bush’s across-the-board tax cuts in 2001, which more Americans at the time said were a “good thing” than a “bad thing,” are a perfect illustration of this.
Whether Americans feel a sense of urgency about enacting tax reform is another matter.
In April 2017, Gallup found that Americans’ concern about their own federal tax burden had actually cooled somewhat, as barely half (51%) felt their taxes were “too high,” down from 57% in 2016. By contrast, in June 1985, the year before the revolutionary Tax Reform Act of 1986 went into effect, 63% of Americans said their taxes were too high.
While public demand for lowering taxes may have waned, it is not gone. Public concern about taxes fell the most over the past year among Republicans — a familiar political pattern given the partisan shift in presidential power. With a Republican in the White House, the Republican rank and file are less likely to say anything negative about the government, including about taxes. Still, 62% of Republicans call their taxes too high, as do 52% of independents and 39% of Democrats.
The implication? While not as intense as Congressional leaders may have expected, public demand for tax reform is still there, especially among the Republicans who may matter most to GOP lawmakers.
Common Ground Exists on Tax Reform
As the U.S. Congress is about to start its summer recess, tax reform remains ill defined by the administration, and negotiations over sub-issues like the border adjustment tax have stalled any pivot to immediate tax legislation. More importantly, there seems to be no bipartisan support this time, while there was under Reagan in 1986. Granted, this may seem like less of an issue now, as Republicans today control both the legislative and executive branches of the federal government. But real tax reform always makes for winners and losers, and it is problematic for only one party to pass new reforms. One need only look at the electoral consequences that Democrats have repeatedly suffered since 2010, the year they passed major healthcare reform legislation on party-line votes, to understand the danger Republicans could face if they pursue tax reform alone.
To make tax reform possible from a bipartisan standpoint, Congress needs to make sure the bill can be branded a “middle-class winner.” As noted previously, Americans favor tax cuts for the middle class, and as the following table shows, Republicans and Democrats are also more likely to believe middle-income people are currently paying too much in taxes than to say they are paying their fair share or paying too little.
Both Party Groups Tend to Believe Middle-Income Americans Pay Too Much in Federal Taxes
Republican/Lean Republican
Democrat/Lean Democratic
%
%
Too much
51
49
Fair share
40
43
Too little
5
7
No opinion
4
1
GALLUP, APRIL 5-9, 2017
To ensure tax reform enjoys at least some bipartisan support, Democrats will need a win during negotiations, meaning taxes would likely need to be raised on the nation’s wealthier class of citizens. Republicans are split on the issue of the fairness of taxes paid by upper-income people, but Democrats are in solid agreement that they pay too little.
Parties Diverge on Perceptions of What Upper-Income Americans Pay in Federal Taxes
Republican/Lean Republican
Democrat/Lean Democratic
%
%
Too much
18
4
Fair share
38
13
Too little
40
82
No opinion
4
1
GALLUP, APRIL 5-9, 2017
Bottom Line
With the Trump administration wanting tax reform before the end of 2017, Ryan is now promising to put it on the front burner. However, even Republican leaders’ enthusiasm for tax reform may not be enough to overcome the triad of legislative challenges that exist: the slimness of the Republican majorities in the U.S. House and Senate, the lack of bipartisanship in Washington and the power of special interest groups in Washington, D.C., to protect their vested interests. This is why comprehensive tax reform is historically so rare.
One thing working in Republicans’ favor is that a majority of Americans support tax relief for the middle class, and members of both major parties tend to believe middle-class taxes are too high. If the bill can be positioned strongly as middle-class tax relief, its chances for success will be higher.
At more than 73,000 pages, it’s no wonder our country’s tax code spells headache for millions of hardworking Americans across the country. This bloated document, riddled with complicated loopholes, is anything but navigable for working-class people who can’t afford to hire accountants, lawyers or tax professionals. Yet like clockwork every spring, Americans throw away countless time and treasure in an attempt to properly comply with the process of giving their hard-earned money to the federal government.
The rigors of compliance aside, our tax code penalizes economic growth and American competitiveness. By imposing some of the highest corporate tax rates in the industrialized world, American business are incentivized to entertain corporate inversions, and leave trillions of dollars of cash abroad where it can’t be invested in American growth. While the well-to-do and well-connected may be able to navigate this byzantine world, taxpayers across the country and throughout the 18 counties in Texas I represent are frustrated, and rightfully so. The American people deserve better.
Frustration with the IRS reached new levels in 2013 when revelations surfaced that the agency was targeting conservative groups. When Congress launched investigations, IRS Commissioner John Koskinen repeatedly obstructed justice by refusing to testify and failing to produce up to 24,000 emails relevant to the investigations. This is simply unacceptable.
To make matters worse, the IRS experienced a cyber-attack in 2015 that left more than 700,000 taxpayer accounts vulnerable. And according to a GAO report released just last month, the IRS has improved only marginally since that time in regard to its data security. Taxpayers should not be subject to the political whims of unelected bureaucrats who refuse to follow the law and falsify facts before Congress, all the while placing their personal financial data at risk.
As a staunch fiscal conservative, I’ve been vocal and outspoken about the need for a fairer, flatter tax code – one that doesn’t stifle growth or punish economic success. After all, Ronald Reagan famously said that the role of government should be to fostereconomic growth, not smother it. That’s why I’ve joined more than 70 of my colleagues in cosponsoring legislation that would eliminate all individual and corporate income taxes – the FairTax Act of 2015 (H.R. 25).
The FairTax Act, introduced by Rep. Rob Woodall (GA-7), eliminates all personal, corporate, gift and estate taxes and replaces them with a simple, point-of-sale consumption tax. Beyond this, it completely abolishes the IRS and all of the bureaucratic red tape and corporate cronyism that comes with it – and remains revenue neutral in the process.
The FairTax Act combats the corruption and inefficiency of the IRS, and instead promotes American growth and investment. I’m proud to be a cosponsor of this key piece of legislation, because it recognizes that more freedom and less government is the formula for economic success. It’s this model that’s allowed Texas to lead the nation in job growth since 2008, and it’s about time for Washington to get an overdue dose of these commonsense, Texas economic values. The FairTax Act will do just that, and I urge my colleagues to support it.
Congressman John Ratcliffe represents Texas’ 4th district, serving the outer eastern suburbs of the Dallas-Fort Worth Metroplexsince 2015. He is a member of the Judiciary Committee as well as the House Homeland Security Committee, serving as Chairman of its Cybersecurity, Infrastructure Protection, and Security Technologies Subcommittee. Prior to Congress, he served as Mayor of Heath, Texas. In addition, during the George W. Bush Administration, he was appointed to multiple posts, including U.S. Attorney and Chief of Anti-Terrorism and National Security for the Eastern District of Texas.
The current federal income tax system is clearly broken — unfair, overly complex, and almost impossible for most Americans to understand. But there is a reasonable, nonpartisan alternative before Congress that is both fair and easy to understand. A system that allows you to keep your whole paycheck and only pay taxes on what you spend.
The FairTax is a national sales tax that treats every person equally and allows American businesses to thrive, while generating the same tax revenue as the current four-million-word-plus tax code. Under the FairTax, every person living in the United States pays a sales tax on purchases of new goods and services, excluding necessities due to the prebate. The FairTax rate after necessities is 23% compared to combining the 15% income tax bracket with the 7.65% of employee payroll taxes under the current system — both of which will be eliminated!
Important to note: the FairTax is the only tax plan currently being proposed that includes the removal of the payroll tax.
Keep Your Paycheck
For the first time in recent history, American workers will get to keep every dime they earn; including what would have been paid in federal income taxes and payroll taxes. You will get an instant raise in your pay!
Social Security & Medicare Funding
Benefits will not change. The FairTax actually puts these programs on a more solid funding foundation. Instead of being funded by taxes on workers’ wages, which is a small pool, they’ll be funded by taxes on overall consumption by all residents. Learn More .
Get a Tax Refund in Advance on Purchases of Basic Necessities
The FairTax provides a progressive program called a prebate. This gives every legal resident household an “advance refund” at the beginning of each month so that purchases made up to the poverty level are tax-free. The prebate prevents an unfair burden on low-income families. Learn more .
Pay Tax on Only What You Spend
Be in control of your financial destiny. You alone can control your tax burden. If you’re thrifty, you’ll pay lower taxes than somebody who is not. Most importantly, you’ll be taxed fairly. Learn moreabout what is taxed.
Everyone Pays Their Fair Share
Tax evasion and the underground economy cost each taxpayer an additional $2,500 every year! But by taxing new products and services consumed, the FairTax puts everyone in the country at the same level at the cash register. Further, only legal residents are eligible for the prebate. Learn more .
The IRS is No Longer Needed
No more complicated tax forms, individual audits, or intrusive federal bureaucracy. Retailers will collect the FairTax just as they do now with state sales taxes. All money will be collected and remitted to the U.S. Treasury, and both the retailers and states will be paid a fee for their collection service. Learn More
Summer looms with GOP stuck on health care, budget, taxes
By The Associated Press
June 30, 2017 4:45 pm
The Capitol in Washington is quiet after lawmakers departed the for the Independence Day recess, Friday, June 30, 2017. The Republican leadership in the Senate decided this week to delay a vote on their…
WASHINGTON (AP) — Republicans are stuck on health care, can’t pass a budget, and hopes for a big, bipartisan infrastructure package are fizzling. Overhauling the tax code looks more and more like a distant dream.
The GOP-led Congress has yet to salt away a single major legislative accomplishment for President Donald Trump — and a summer of drift may lead to a logistical nightmare this fall.
Instead, Trump’s allies appear both divided and indecisive, unable to deliver on his agenda while letting other must-do congressional business — chiefly their core responsibilities of passing a budget and spending bills, and keeping the government solvent — slide onto an already daunting fall agenda that is looking more and more like it’ll be a train wreck.
Friday brought more bad news for Speaker Paul Ryan, R-Wis., and other House leaders as 20 GOP moderates signaled a revolt on the budget, penning a letter to Ryan announcing their opposition to an emerging plan to force cuts to government agencies and benefit programs such as food stamps. The letter, authored by Rep. Charlie Dent, R-Pa., warned that without an agreement with Democrats on increasing agency spending, moderates will be “reticent to support any budget.”
“It’s looking like they’re very disorganized. They got obviously a lot of conflict over spending preferences and it’s not just a two-way conflict,” said top House Budget Committee Democrat John Yarmuth of Kentucky. “It’s just a tough Rubik’s Cube they’re trying to solve.”
So it’s not just the Senate effort to repeal and replace Democrat Barack Obama’s health care law that’s foundering. The annual congressional budget measure — a prerequisite to this fall’s hoped-for tax effort — is languishing as well, as are the 12 annual spending bills that typically consume weeks of House floor time each summer.
But GOP leaders say all is going well. Ryan told a Wisconsin radio host on Thursday that “it’s the most productive Congress since the mid-’80s” and issued a news release Friday titled “Despite What You May Hear, We Are Getting Things Done.” The release cites a bipartisan Department of Veterans Affairs accountability measure and 14 bills repealing Obama-era regulations as Congress’ top achievements.
“It would be hard to fault the average American for thinking all that’s going on in Washington these days is high-drama hearings and partisan sniping,” Ryan said. “But amid the countdown clocks and cable news chatter, something important is happening: Congress is getting things done to help improve people’s lives.”
In the first year of a presidency, the annual August congressional recess is a traditional point to take stock. By that point, Obama had signed an economic recovery bill and President George W. Bush had won his landmark tax cuts, while President Bill Clinton was celebrating a hard-fought budget package.
Trump has no comparable successes to trumpet — but his allies in Congress say they’re not worried.
“We laid out an agenda in November and December, and we’re needing to get there,” said House Rules Committee Chairman Pete Sessions, R-Texas. “And we can effectively get there. The questions that confound us are those that we can answer ourselves. And we will.”
And as Republicans are stalled on health care, the budget and infrastructure, there are several other problems that need to be taken care of, including increasing the nation’s borrowing authority, preventing a government shutdown, and lifting budget “caps” that are hobbling efforts to beef up the military.
Unlike health care, the debt limit and a deal to fix the spending caps — a leftover from a failed 2011 budget deal — can only be resolved with Democratic help. However, they promise to consume political capital and valuable time and energy, and there’s no political pay-off, other than forestalling disaster.
First, Congress is off on vacation to return in July for a three-week session. Then comes the traditional monthlong August recess.
After Labor Day comes a four-week sprint to October and the deadline to avert a government shutdown with a temporary spending bill — and to forestall a disastrous default on U.S. obligations by lifting the debt limit, which is a politically toxic vote for many Republicans.
Sentiment is building among some lawmakers to shorten the recess to make progress on the unfinished work that is piling up. On Friday, 10 GOP senators, led by David Perdue of Georgia, sent Majority Leader Mitch McConnell, R-Ky., a letter citing delays on health care, the budget, a stopgap spending bill and the debt limit as reasons to consider canceling some or all of the recess.
“If we successfully navigate those priorities, we can finally get to our once in a generation opportunity on tax reform,” the letter said. “Growing the economy, repairing our infrastructure, and rebuilding our military are all dependent on accomplishing the tasks before us.”
High-income Americans pay most income taxes, but enough to be ‘fair’?
BY DREW DESILVER
Tax-deadline season isn’t many people’s favorite time of the year, but most Americans are OK with the amount of tax they pay. It’s what other people pay, or don’t pay, that bothers them.
Just over half (54%) of Americans surveyed in fall by Pew Research Center said they pay about the right amount in taxes considering what they get from the federal government, versus 40% who said they pay more than their fair share. But in a separate 2015 surveyby the Center, some six-in-ten Americans said they were bothered a lot by the feeling that “some wealthy people” and “some corporations” don’t pay their fair share.
It’s true that corporations are funding a smaller share of overall government operations than they used to. In fiscal 2015, the federal government collected $343.8 billion from corporate income taxes, or 10.6% of its total revenue. Back in the 1950s, corporate income tax generated between a quarter and a third of federal revenues (though payroll taxes have grown considerably over that period).
Nor have corporate tax receipts kept pace with the overall growth of the U.S. economy. Inflation-adjusted gross domestic product has risen 153% since 1980, while inflation-adjusted corporate tax receipts were 115% higher in fiscal 2015 than in fiscal 1980, according to the Bureau of Economic Analysis. There have been a lot of ups and downs over that period, as corporate tax receipts tend to rise during expansions and drop off in recessions. In fiscal 2007, for instance, corporate taxes hit $370.2 billion (in current dollars), only to plunge to $138.2 billion in 2009 as businesses felt the impact of the Great Recession.
Corporations also employ battalions of tax lawyers to find ways to reduce their tax bills, from running income through subsidiaries in low-tax foreign countries to moving overseas entirely, in what’s known as a corporate inversion (a practice the Treasury Department has moved to discourage).
But in Tax Land, the line between corporations and people can be fuzzy. While most major corporations (“C corporations” in tax lingo) pay according to the corporate tax laws, many other kinds of businesses – sole proprietorships, partnerships and closely held “S corporations” – fall under the individual income tax code, because their profits and losses are passed through to individuals. And by design, wealthier Americans pay most of the nation’s total individual income taxes.
In 2014, people with adjusted gross income, or AGI, above $250,000 paid just over half (51.6%) of all individual income taxes, though they accounted for only 2.7% of all returns filed, according to our analysis of preliminary IRS data. Their average tax rate (total taxes paid divided by cumulative AGI) was 25.7%. By contrast, people with incomes of less than $50,000 accounted for 62.3% of all individual returns filed, but they paid just 5.7% of total taxes. Their average tax rate was 4.3%.
The relative tax burdens borne by different income groups changes over time, due both to economic conditions and the constantly shifting provisions of tax law. For example, using more comprehensive IRS data covering tax years 2000 through 2011, we found that people who made between $100,000 and $200,000 paid 23.8% of the total tax liability in 2011, up from 18.8% in 2000. Filers in the $50,000-to-$75,000 group, on the other hand, paid 12% of the total liability in 2000 but only 9.1% in 2011. (The tax liability figures include a few taxes, such as self-employment tax and the “nanny tax,” that people typically pay along with their income taxes.)
All told, individual income taxes accounted for a little less than half (47.4%) of government revenue, a share that’s been roughly constant since World War II. The federal government collected $1.54 trillion from individual income taxes in fiscal 2015, making it the national government’s single-biggest revenue source. (Other sources of federal revenue include corporate income taxes, the payroll taxes that fund Social Security and Medicare, excise taxes such as those on gasoline and cigarettes, estate taxes, customs duties and payments from the Federal Reserve.) Until the 1940s, when the income tax was expanded to help fund the war effort, generally only the very wealthy paid it.
Since the 1970s, the segment of federal revenues that has grown the most is the payroll tax – those line items on your pay stub that go to pay for Social Security and Medicare. For most people, in fact, payroll taxes take a bigger bite out of their paycheck than federal income tax. Why? The 6.2% Social Security withholding tax only applies to wages up to $118,500. For example, a worker earning $40,000 will pay $2,480 (6.2%) in Social Security tax, but an executive earning $400,000 will pay $7,347 (6.2% of $118,500), for an effective rate of just 1.8%. By contrast, the 1.45% Medicare tax has no upper limit, and in fact high earners pay an extra 0.9%.
All but the top-earning 20% of American families pay more in payroll taxes than in federal income taxes, according to a Treasury Department analysis.
Still, that analysis confirms that, after all federal taxes are factored in, the U.S. tax system as a whole is progressive. The top 0.1% of families pay the equivalent of 39.2% and the bottom 20% have negative tax rates (that is, they get more money back from the government in the form of refundable tax credits than they pay in taxes).
Of course, people can and will differ on whether any of this constitutes a “fair” tax system. Depending on their politics and personal situations, some would argue for a more steeply progressive structure, others for a flatter one. Finding the right balance can be challenging to the point of impossibility: As Jean-Baptiste Colbert, Louis XIV’s finance minister, is said to have remarked: “The art of taxation consists in so plucking the goose as to obtain the largest possible amount of feathers with the smallest possible amount of hissing.”
Note: This is an update of an earlier post published March 24, 2015.
Summary of the Latest Federal Income Tax Data, 2016 Update
February 1, 2017
Scott Greenberg
The Internal Revenue Service has recently released new data on individual income taxes for calendar year 2014, showing the number of taxpayers, adjusted gross income, and income tax shares by income percentiles.[1]
The data demonstrates that the U.S. individual income tax continues to be very progressive, borne mainly by the highest income earners.
In 2014, 139.6 million taxpayers reported earning $9.71 trillion in adjusted gross income and paid $1.37 trillion in individual income taxes.
The share of income earned by the top 1 percent of taxpayers rose to 20.6 percent in 2014. Their share of federal individual income taxes also rose, to 39.5 percent.
In 2014, the top 50 percent of all taxpayers paid 97.3 percent of all individual income taxes while the bottom 50 percent paid the remaining 2.7 percent.
The top 1 percent paid a greater share of individual income taxes (39.5 percent) than the bottom 90 percent combined (29.1 percent).
The top 1 percent of taxpayers paid a 27.1 percent individual income tax rate, which is more than seven times higher than taxpayers in the bottom 50 percent (3.5 percent).
Reported Income and Taxes Paid Both Increased Significantly in 2014
Taxpayers reported $9.71 trillion in adjusted gross income (AGI) on 139.5 million tax returns in 2014. Total AGI grew by $675 billion from the previous year’s levels. There were 1.2 million more returns filed in 2014 than in 2013, meaning that average AGI rose by $4,252 per return, or 6.5 percent.
Meanwhile, taxpayers paid $1.37 trillion in individual income taxes in 2014, an 11.5 percent increase from taxes paid in the previous year. The average individual income tax rate for all taxpayers rose from 13.64 percent to 14.16 percent. Moreover, the average tax rate increased for all income groups, except for the top 0.1 percent of taxpayers, whose average rate decreased from 27.91 percent to 27.67 percent.
The most likely explanation behind the higher tax rates in 2014 is a phenomenon known as “real bracket creep.” [2] As incomes rise, households are pushed into higher tax brackets, and are subject to higher overall tax rates on their income. On the other hand, the likely reason why the top 0.1 percent of households saw a slightly lower tax rate in 2014 is because a higher portion of their income consisted of long-term capital gains, which are subject to lower tax rates.[3]
The share of income earned by the top 1 percent rose to 20.58 percent of total AGI, up from 19.04 percent in 2013. The share of the income tax burden for the top 1 percent also rose, from 37.80 percent in 2013 to 39.48 percent in 2014.
Top 1%
Top 5%
Top 10%
Top 25%
Top 50%
Bottom 50%
All Taxpayers
Table 1. Summary of Federal Income Tax Data, 2014
Number of Returns
1,395,620
6,978,102
13,956,203
34,890,509
69,781,017
69,781,017
139,562,034
Adjusted Gross Income ($ millions)
$1,997,819
$3,490,867
$4,583,416
$6,690,287
$8,614,544
$1,094,119
$9,708,663
Share of Total Adjusted Gross Income
20.58%
35.96%
47.21%
68.91%
88.73%
11.27%
100.00%
Income Taxes Paid ($ millions)
$542,640
$824,153
$974,124
$1,192,679
$1,336,637
$37,740
$1,374,379
Share of Total Income Taxes Paid
39.48%
59.97%
70.88%
86.78%
97.25%
2.75%
100.00%
Income Split Point
$465,626
$188,996
$133,445
$77,714
$38,173
Average Tax Rate
27.16%
23.61%
21.25%
17.83%
15.52%
3.45%
14.16%
Note: Does not include dependent filers
High-Income Americans Paid the Majority of Federal Taxes
In 2014, the bottom 50 percent of taxpayers (those with AGIs below $38,173) earned 11.27 percent of total AGI. This group of taxpayers paid approximately $38 billion in taxes, or 2.75 percent of all income taxes in 2014.
In contrast, the top 1 percent of all taxpayers (taxpayers with AGIs of $465,626 and above) earned 20.58 percent of all AGI in 2014, but paid 39.48 percent of all federal income taxes.
In 2014, the top 1 percent of taxpayers accounted for more income taxes paid than the bottom 90 percent combined. The top 1 percent of taxpayers paid $543 billion, or 39.48 percent of all income taxes, while the bottom 90 percent paid $400 billion, or 29.12 percent of all income taxes.
Figure 1.
High-Income Taxpayers Pay the Highest Average Tax Rates
The 2014 IRS data shows that taxpayers with higher incomes pay much higher average individual income tax rates than lower-income taxpayers.[4]
The bottom 50 percent of taxpayers (taxpayers with AGIs below $38,173) faced an average income tax rate of 3.45 percent. As household income increases, the IRS data shows that average income tax rates rise. For example, taxpayers with AGIs between the 10th and 5th percentile ($133,445 and $188,996) pay an average rate of 13.7 percent – almost four times the rate paid by those in the bottom 50 percent.
The top 1 percent of taxpayers (AGI of $465,626 and above) paid the highest effective income tax rate, at 27.2 percent, 7.9 times the rate faced by the bottom 50 percent of taxpayers.
Figure 2.
Taxpayers at the very top of the income distribution, the top 0.1 percent (with AGIs over $2.14 million), paid an even higher average tax rate, of 27.7 percent.
Appendix
Year
Total
Top 0.1%
Top 1%
Top
5%
Between
5% & 10%
Top 10%
Between 10% & 25%
Top 25%
Between 25% & 50%
Top 50%
Bottom 50%
Table 2. Number of Federal Individual Income Tax Returns Filed 1980–2014 (Thousands)
Source: Internal Revenue Service.
1980
93,239
932
4,662
4,662
9,324
13,986
23,310
23,310
46,619
46,619
1981
94,587
946
4,729
4,729
9,459
14,188
23,647
23,647
47,293
47,293
1982
94,426
944
4,721
4,721
9,443
14,164
23,607
23,607
47,213
47,213
1983
95,331
953
4,767
4,767
9,533
14,300
23,833
23,833
47,665
47,665
1984
98,436
984
4,922
4,922
9,844
14,765
24,609
24,609
49,218
49,219
1985
100,625
1,006
5,031
5,031
10,063
15,094
25,156
25,156
50,313
50,313
1986
102,088
1,021
5,104
5,104
10,209
15,313
25,522
25,522
51,044
51,044
The Tax Reform Act of 1986 changed the definition of AGI, so data above and below this line not strictly comparable
1987
106,155
1,062
5,308
5,308
10,615
15,923
26,539
26,539
53,077
53,077
1988
108,873
1,089
5,444
5,444
10,887
16,331
27,218
27,218
54,436
54,436
1989
111,313
1,113
5,566
5,566
11,131
16,697
27,828
27,828
55,656
55,656
1990
112,812
1,128
5,641
5,641
11,281
16,922
28,203
28,203
56,406
56,406
1991
113,804
1,138
5,690
5,690
11,380
17,071
28,451
28,451
56,902
56,902
1992
112,653
1,127
5,633
5,633
11,265
16,898
28,163
28,163
56,326
56,326
1993
113,681
1,137
5,684
5,684
11,368
17,052
28,420
28,420
56,841
56,841
1994
114,990
1,150
5,749
5,749
11,499
17,248
28,747
28,747
57,495
57,495
1995
117,274
1,173
5,864
5,864
11,727
17,591
29,319
29,319
58,637
58,637
1996
119,442
1,194
5,972
5,972
11,944
17,916
29,860
29,860
59,721
59,721
1997
121,503
1,215
6,075
6,075
12,150
18,225
30,376
30,376
60,752
60,752
1998
123,776
1,238
6,189
6,189
12,378
18,566
30,944
30,944
61,888
61,888
1999
126,009
1,260
6,300
6,300
12,601
18,901
31,502
31,502
63,004
63,004
2000
128,227
1,282
6,411
6,411
12,823
19,234
32,057
32,057
64,114
64,114
The IRS changed methodology, so data above and below this line not strictly comparable
2001
119,371
119
1,194
5,969
5,969
11,937
17,906
29,843
29,843
59,685
59,685
2002
119,851
120
1,199
5,993
5,993
11,985
17,978
29,963
29,963
59,925
59,925
2003
120,759
121
1,208
6,038
6,038
12,076
18,114
30,190
30,190
60,379
60,379
2004
122,510
123
1,225
6,125
6,125
12,251
18,376
30,627
30,627
61,255
61,255
2005
124,673
125
1,247
6,234
6,234
12,467
18,701
31,168
31,168
62,337
62,337
2006
128,441
128
1,284
6,422
6,422
12,844
19,266
32,110
32,110
64,221
64,221
2007
132,655
133
1,327
6,633
6,633
13,265
19,898
33,164
33,164
66,327
66,327
2008
132,892
133
1,329
6,645
6,645
13,289
19,934
33,223
33,223
66,446
66,446
2009
132,620
133
1,326
6,631
6,631
13,262
19,893
33,155
33,155
66,310
66,310
2010
135,033
135
1,350
6,752
6,752
13,503
20,255
33,758
33,758
67,517
67,517
2011
136,586
137
1,366
6,829
6,829
13,659
20,488
34,146
34,146
68,293
68,293
2012
136,080
136
1,361
6,804
6,804
13,608
20,412
34,020
34,020
68,040
68,040
2013
138,313
138
1,383
6,916
6,916
13,831
20,747
34,578
34,578
69,157
69,157
2014
139,562
140
1,396
6,978
6,978
13,956
20,934
34,891
34,891
69,781
69,781
Year
Total
Top 0.1%
Top 1%
Top 5%
Between 5% & 10%
Top 10%
Between 10% & 25%
Top 25%
Between 25% & 50%
Top 50%
Bottom 50%
Table 3. Adjusted Gross Income of Taxpayers in Various Income Brackets, 1980–2014 ($Billions)
Source: Internal Revenue Service.
1980
$1,627
$138
$342
$181
$523
$400
$922
$417
$1,339
$288
1981
$1,791
$149
$372
$201
$573
$442
$1,015
$458
$1,473
$318
1982
$1,876
$167
$398
$207
$605
$460
$1,065
$478
$1,544
$332
1983
$1,970
$183
$428
$217
$646
$481
$1,127
$498
$1,625
$344
1984
$2,173
$210
$482
$240
$723
$528
$1,251
$543
$1,794
$379
1985
$2,344
$235
$531
$260
$791
$567
$1,359
$580
$1,939
$405
1986
$2,524
$285
$608
$278
$887
$604
$1,490
$613
$2,104
$421
The Tax Reform Act of 1986 changed the definition of AGI, so data above and below this line not strictly comparable
1987
$2,814
$347
$722
$316
$1,038
$671
$1,709
$664
$2,374
$440
1988
$3,124
$474
$891
$342
$1,233
$718
$1,951
$707
$2,658
$466
1989
$3,299
$468
$918
$368
$1,287
$768
$2,054
$751
$2,805
$494
1990
$3,451
$483
$953
$385
$1,338
$806
$2,144
$788
$2,933
$519
1991
$3,516
$457
$943
$400
$1,343
$832
$2,175
$809
$2,984
$532
1992
$3,681
$524
$1,031
$413
$1,444
$856
$2,299
$832
$3,131
$549
1993
$3,776
$521
$1,048
$426
$1,474
$883
$2,358
$854
$3,212
$563
1994
$3,961
$547
$1,103
$449
$1,552
$929
$2,481
$890
$3,371
$590
1995
$4,245
$620
$1,223
$482
$1,705
$985
$2,690
$938
$3,628
$617
1996
$4,591
$737
$1,394
$515
$1,909
$1,043
$2,953
$992
$3,944
$646
1997
$5,023
$873
$1,597
$554
$2,151
$1,116
$3,268
$1,060
$4,328
$695
1998
$5,469
$1,010
$1,797
$597
$2,394
$1,196
$3,590
$1,132
$4,721
$748
1999
$5,909
$1,153
$2,012
$641
$2,653
$1,274
$3,927
$1,199
$5,126
$783
2000
$6,424
$1,337
$2,267
$688
$2,955
$1,358
$4,314
$1,276
$5,590
$834
The IRS changed methodology, so data above and below this line not strictly comparable
2001
$6,116
$492
$1,065
$1,934
$666
$2,600
$1,334
$3,933
$1,302
$5,235
$881
2002
$5,982
$421
$960
$1,812
$660
$2,472
$1,339
$3,812
$1,303
$5,115
$867
2003
$6,157
$466
$1,030
$1,908
$679
$2,587
$1,375
$3,962
$1,325
$5,287
$870
2004
$6,735
$615
$1,279
$2,243
$725
$2,968
$1,455
$4,423
$1,403
$5,826
$908
2005
$7,366
$784
$1,561
$2,623
$778
$3,401
$1,540
$4,940
$1,473
$6,413
$953
2006
$7,970
$895
$1,761
$2,918
$841
$3,760
$1,652
$5,412
$1,568
$6,980
$990
2007
$8,622
$1,030
$1,971
$3,223
$905
$4,128
$1,770
$5,898
$1,673
$7,571
$1,051
2008
$8,206
$826
$1,657
$2,868
$905
$3,773
$1,782
$5,555
$1,673
$7,228
$978
2009
$7,579
$602
$1,305
$2,439
$878
$3,317
$1,740
$5,058
$1,620
$6,678
$900
2010
$8,040
$743
$1,517
$2,716
$915
$3,631
$1,800
$5,431
$1,665
$7,096
$944
2011
$8,317
$737
$1,556
$2,819
$956
$3,775
$1,866
$5,641
$1,716
$7,357
$961
2012
$9,042
$1,017
$1,977
$3,331
$997
$4,328
$1,934
$6,262
$1,776
$8,038
$1,004
2013
$9,034
$816
$1,720
$3,109
$1,034
$4,143
$2,008
$6,152
$1,844
$7,996
$1,038
2014
$9,709
$986
$1,998
$3,491
$1,093
$4,583
$2,107
$6,690
$1,924
$8,615
$1,094
Year
Total
Top 0.1%
Top 1%
Top 5%
Between 5% & 10%
Top 10%
Between 10% & 25%
Top 25%
Between 25% & 50%
Top 50%
Bottom 50%
Table 4. Total Income Tax after Credits, 1980–2014 ($Billions)
Source: Internal Revenue Service.
1980
$249
$47
$92
$31
$123
$59
$182
$50
$232
$18
1981
$282
$50
$99
$36
$135
$69
$204
$57
$261
$21
1982
$276
$53
$100
$34
$134
$66
$200
$56
$256
$20
1983
$272
$55
$101
$34
$135
$64
$199
$54
$252
$19
1984
$297
$63
$113
$37
$150
$68
$219
$57
$276
$22
1985
$322
$70
$125
$41
$166
$73
$238
$60
$299
$23
1986
$367
$94
$156
$44
$201
$78
$279
$64
$343
$24
The Tax Reform Act of 1986 changed the definition of AGI, so data above and below this line not strictly comparable
1987
$369
$92
$160
$46
$205
$79
$284
$63
$347
$22
1988
$413
$114
$188
$48
$236
$85
$321
$68
$389
$24
1989
$433
$109
$190
$51
$241
$93
$334
$73
$408
$25
1990
$447
$112
$195
$52
$248
$97
$344
$77
$421
$26
1991
$448
$111
$194
$56
$250
$96
$347
$77
$424
$25
1992
$476
$131
$218
$58
$276
$97
$374
$78
$452
$24
1993
$503
$146
$238
$60
$298
$101
$399
$80
$479
$24
1994
$535
$154
$254
$64
$318
$108
$425
$84
$509
$25
1995
$588
$178
$288
$70
$357
$115
$473
$88
$561
$27
1996
$658
$213
$335
$76
$411
$124
$535
$95
$630
$28
1997
$727
$241
$377
$82
$460
$134
$594
$102
$696
$31
1998
$788
$274
$425
$88
$513
$139
$652
$103
$755
$33
1999
$877
$317
$486
$97
$583
$150
$733
$109
$842
$35
2000
$981
$367
$554
$106
$660
$164
$824
$118
$942
$38
The IRS changed methodology, so data above and below this line not strictly comparable
2001
$885
$139
$294
$462
$101
$564
$158
$722
$120
$842
$43
2002
$794
$120
$263
$420
$93
$513
$143
$657
$104
$761
$33
2003
$746
$115
$251
$399
$85
$484
$133
$617
$98
$715
$30
2004
$829
$142
$301
$467
$91
$558
$137
$695
$102
$797
$32
2005
$932
$176
$361
$549
$98
$647
$145
$793
$106
$898
$33
2006
$1,020
$196
$402
$607
$108
$715
$157
$872
$113
$986
$35
2007
$1,112
$221
$443
$666
$117
$783
$170
$953
$122
$1,075
$37
2008
$1,029
$187
$386
$597
$115
$712
$168
$880
$117
$997
$32
2009
$863
$146
$314
$502
$101
$604
$146
$749
$93
$842
$21
2010
$949
$170
$355
$561
$110
$670
$156
$827
$100
$927
$22
2011
$1,043
$168
$366
$589
$123
$712
$181
$893
$120
$1,012
$30
2012
$1,185
$220
$451
$699
$133
$831
$193
$1,024
$128
$1,152
$33
2013
$1,232
$228
$466
$721
$139
$860
$203
$1,063
$135
$1,198
$34
2014
$1,374
$273
$543
$824
$150
$974
$219
$1,193
$144
$1,337
$38
Year
Total
Top 0.1%
Top 1%
Top 5%
Between 5% & 10%
Top 10%
Between 10% & 25%
Top 25%
Between 25% & 50%
Top 50%
Bottom 50%
Table 5. Adjusted Gross Income Shares, 1980–2014 (percent of total AGI earned by each group)
Source: Internal Revenue Service.
1980
100%
8.46%
21.01%
11.12%
32.13%
24.57%
56.70%
25.62%
82.32%
17.68%
1981
100%
8.30%
20.78%
11.20%
31.98%
24.69%
56.67%
25.59%
82.25%
17.75%
1982
100%
8.91%
21.23%
11.03%
32.26%
24.53%
56.79%
25.50%
82.29%
17.71%
1983
100%
9.29%
21.74%
11.04%
32.78%
24.44%
57.22%
25.30%
82.52%
17.48%
1984
100%
9.66%
22.19%
11.06%
33.25%
24.31%
57.56%
25.00%
82.56%
17.44%
1985
100%
10.03%
22.67%
11.10%
33.77%
24.21%
57.97%
24.77%
82.74%
17.26%
1986
100%
11.30%
24.11%
11.02%
35.12%
23.92%
59.04%
24.30%
83.34%
16.66%
The Tax Reform Act of 1986 changed the definition of AGI, so data above and below this line not strictly comparable
1987
100%
12.32%
25.67%
11.23%
36.90%
23.85%
60.75%
23.62%
84.37%
15.63%
1988
100%
15.16%
28.51%
10.94%
39.45%
22.99%
62.44%
22.63%
85.07%
14.93%
1989
100%
14.19%
27.84%
11.16%
39.00%
23.28%
62.28%
22.76%
85.04%
14.96%
1990
100%
14.00%
27.62%
11.15%
38.77%
23.36%
62.13%
22.84%
84.97%
15.03%
1991
100%
12.99%
26.83%
11.37%
38.20%
23.65%
61.85%
23.01%
84.87%
15.13%
1992
100%
14.23%
28.01%
11.21%
39.23%
23.25%
62.47%
22.61%
85.08%
14.92%
1993
100%
13.79%
27.76%
11.29%
39.05%
23.40%
62.45%
22.63%
85.08%
14.92%
1994
100%
13.80%
27.85%
11.34%
39.19%
23.45%
62.64%
22.48%
85.11%
14.89%
1995
100%
14.60%
28.81%
11.35%
40.16%
23.21%
63.37%
22.09%
85.46%
14.54%
1996
100%
16.04%
30.36%
11.23%
41.59%
22.73%
64.32%
21.60%
85.92%
14.08%
1997
100%
17.38%
31.79%
11.03%
42.83%
22.22%
65.05%
21.11%
86.16%
13.84%
1998
100%
18.47%
32.85%
10.92%
43.77%
21.87%
65.63%
20.69%
86.33%
13.67%
1999
100%
19.51%
34.04%
10.85%
44.89%
21.57%
66.46%
20.29%
86.75%
13.25%
2000
100%
20.81%
35.30%
10.71%
46.01%
21.15%
67.15%
19.86%
87.01%
12.99%
The IRS changed methodology, so data above and below this line not strictly comparable
2001
100%
8.05%
17.41%
31.61%
10.89%
42.50%
21.80%
64.31%
21.29%
85.60%
14.40%
2002
100%
7.04%
16.05%
30.29%
11.04%
41.33%
22.39%
63.71%
21.79%
85.50%
14.50%
2003
100%
7.56%
16.73%
30.99%
11.03%
42.01%
22.33%
64.34%
21.52%
85.87%
14.13%
2004
100%
9.14%
18.99%
33.31%
10.77%
44.07%
21.60%
65.68%
20.83%
86.51%
13.49%
2005
100%
10.64%
21.19%
35.61%
10.56%
46.17%
20.90%
67.07%
19.99%
87.06%
12.94%
2006
100%
11.23%
22.10%
36.62%
10.56%
47.17%
20.73%
67.91%
19.68%
87.58%
12.42%
2007
100%
11.95%
22.86%
37.39%
10.49%
47.88%
20.53%
68.41%
19.40%
87.81%
12.19%
2008
100%
10.06%
20.19%
34.95%
11.03%
45.98%
21.71%
67.69%
20.39%
88.08%
11.92%
2009
100%
7.94%
17.21%
32.18%
11.59%
43.77%
22.96%
66.74%
21.38%
88.12%
11.88%
2010
100%
9.24%
18.87%
33.78%
11.38%
45.17%
22.38%
67.55%
20.71%
88.26%
11.74%
2011
100%
8.86%
18.70%
33.89%
11.50%
45.39%
22.43%
67.82%
20.63%
88.45%
11.55%
2012
100%
11.25%
21.86%
36.84%
11.03%
47.87%
21.39%
69.25%
19.64%
88.90%
11.10%
2013
100%
9.03%
19.04%
34.42%
11.45%
45.87%
22.23%
68.10%
20.41%
88.51%
11.49%
2014
100%
10.16%
20.58%
35.96%
11.25%
47.21%
21.70%
68.91%
19.82%
88.73%
11.27%
Year
Total
Top 0.1%
Top 1%
Top 5%
Between 5% & 10%
Top 10%
Between 10% & 25%
Top 25%
Between 25% & 50%
Top 50%
Bottom 50%
Table 6. Total Income Tax Shares, 1980–2014 (percent of federal income tax paid by each group)
Source: Internal Revenue Service.
1980
100%
19.05%
36.84%
12.44%
49.28%
23.74%
73.02%
19.93%
92.95%
7.05%
1981
100%
17.58%
35.06%
12.90%
47.96%
24.33%
72.29%
20.26%
92.55%
7.45%
1982
100%
19.03%
36.13%
12.45%
48.59%
23.91%
72.50%
20.15%
92.65%
7.35%
1983
100%
20.32%
37.26%
12.44%
49.71%
23.39%
73.10%
19.73%
92.83%
7.17%
1984
100%
21.12%
37.98%
12.58%
50.56%
22.92%
73.49%
19.16%
92.65%
7.35%
1985
100%
21.81%
38.78%
12.67%
51.46%
22.60%
74.06%
18.77%
92.83%
7.17%
1986
100%
25.75%
42.57%
12.12%
54.69%
21.33%
76.02%
17.52%
93.54%
6.46%
The Tax Reform Act of 1986 changed the definition of AGI, so data above and below this line not strictly comparable
1987
100%
24.81%
43.26%
12.35%
55.61%
21.31%
76.92%
17.02%
93.93%
6.07%
1988
100%
27.58%
45.62%
11.66%
57.28%
20.57%
77.84%
16.44%
94.28%
5.72%
1989
100%
25.24%
43.94%
11.85%
55.78%
21.44%
77.22%
16.94%
94.17%
5.83%
1990
100%
25.13%
43.64%
11.73%
55.36%
21.66%
77.02%
17.16%
94.19%
5.81%
1991
100%
24.82%
43.38%
12.45%
55.82%
21.46%
77.29%
17.23%
94.52%
5.48%
1992
100%
27.54%
45.88%
12.12%
58.01%
20.47%
78.48%
16.46%
94.94%
5.06%
1993
100%
29.01%
47.36%
11.88%
59.24%
20.03%
79.27%
15.92%
95.19%
4.81%
1994
100%
28.86%
47.52%
11.93%
59.45%
20.10%
79.55%
15.68%
95.23%
4.77%
1995
100%
30.26%
48.91%
11.84%
60.75%
19.62%
80.36%
15.03%
95.39%
4.61%
1996
100%
32.31%
50.97%
11.54%
62.51%
18.80%
81.32%
14.36%
95.68%
4.32%
1997
100%
33.17%
51.87%
11.33%
63.20%
18.47%
81.67%
14.05%
95.72%
4.28%
1998
100%
34.75%
53.84%
11.20%
65.04%
17.65%
82.69%
13.10%
95.79%
4.21%
1999
100%
36.18%
55.45%
11.00%
66.45%
17.09%
83.54%
12.46%
96.00%
4.00%
2000
100%
37.42%
56.47%
10.86%
67.33%
16.68%
84.01%
12.08%
96.09%
3.91%
The IRS changed methodology, so data above and below this line not strictly comparable
2001
100%
15.68%
33.22%
52.24%
11.44%
63.68%
17.88%
81.56%
13.54%
95.10%
4.90%
2002
100%
15.09%
33.09%
52.86%
11.77%
64.63%
18.04%
82.67%
13.12%
95.79%
4.21%
2003
100%
15.37%
33.69%
53.54%
11.35%
64.89%
17.87%
82.76%
13.17%
95.93%
4.07%
2004
100%
17.12%
36.28%
56.35%
10.96%
67.30%
16.52%
83.82%
12.31%
96.13%
3.87%
2005
100%
18.91%
38.78%
58.93%
10.52%
69.46%
15.61%
85.07%
11.35%
96.41%
3.59%
2006
100%
19.24%
39.36%
59.49%
10.59%
70.08%
15.41%
85.49%
11.10%
96.59%
3.41%
2007
100%
19.84%
39.81%
59.90%
10.51%
70.41%
15.30%
85.71%
10.93%
96.64%
3.36%
2008
100%
18.20%
37.51%
58.06%
11.14%
69.20%
16.37%
85.57%
11.33%
96.90%
3.10%
2009
100%
16.91%
36.34%
58.17%
11.72%
69.89%
16.85%
86.74%
10.80%
97.54%
2.46%
2010
100%
17.88%
37.38%
59.07%
11.55%
70.62%
16.49%
87.11%
10.53%
97.64%
2.36%
2011
100%
16.14%
35.06%
56.49%
11.77%
68.26%
17.36%
85.62%
11.50%
97.11%
2.89%
2012
100%
18.60%
38.09%
58.95%
11.22%
70.17%
16.25%
86.42%
10.80%
97.22%
2.78%
2013
100%
18.48%
37.80%
58.55%
11.25%
69.80%
16.47%
86.27%
10.94%
97.22%
2.78%
2014
100%
19.85%
39.48%
59.97%
10.91%
70.88%
15.90%
86.78%
10.47%
97.25%
2.75%
Year
Total
Top 1%
Top 5%
Top 10%
Top 25%
Top 50%
Table 7. Dollar Cut-Off, 1980–2014 (Minimum AGI for Tax Returns to Fall into Various Percentiles; Thresholds Not Adjusted for Inflation)
1980
$80,580
$43,792
$35,070
$23,606
$12,936
1981
$85,428
$47,845
$38,283
$25,655
$14,000
1982
$89,388
$49,284
$39,676
$27,027
$14,539
1983
$93,512
$51,553
$41,222
$27,827
$15,044
1984
$100,889
$55,423
$43,956
$29,360
$15,998
1985
$108,134
$58,883
$46,322
$30,928
$16,688
1986
$118,818
$62,377
$48,656
$32,242
$17,302
The Tax Reform Act of 1986 changed the definition of AGI, so data above and below this line not strictly comparable
1987
$139,289
$68,414
$52,921
$33,983
$17,768
1988
$157,136
$72,735
$55,437
$35,398
$18,367
1989
$163,869
$76,933
$58,263
$36,839
$18,993
1990
$167,421
$79,064
$60,287
$38,080
$19,767
1991
$170,139
$81,720
$61,944
$38,929
$20,097
1992
$181,904
$85,103
$64,457
$40,378
$20,803
1993
$185,715
$87,386
$66,077
$41,210
$21,179
1994
$195,726
$91,226
$68,753
$42,742
$21,802
1995
$209,406
$96,221
$72,094
$44,207
$22,344
1996
$227,546
$101,141
$74,986
$45,757
$23,174
1997
$250,736
$108,048
$79,212
$48,173
$24,393
1998
$269,496
$114,729
$83,220
$50,607
$25,491
1999
$293,415
$120,846
$87,682
$52,965
$26,415
2000
$313,469
$128,336
$92,144
$55,225
$27,682
The IRS changed methodology, so data above and below this line not strictly comparable
2001
$1,393,718
$306,635
$132,082
$96,151
$59,026
$31,418
2002
$1,245,352
$296,194
$130,750
$95,699
$59,066
$31,299
2003
$1,317,088
$305,939
$133,741
$97,470
$59,896
$31,447
2004
$1,617,918
$339,993
$140,758
$101,838
$62,794
$32,622
2005
$1,938,175
$379,261
$149,216
$106,864
$64,821
$33,484
2006
$2,124,625
$402,603
$157,390
$112,016
$67,291
$34,417
2007
$2,251,017
$426,439
$164,883
$116,396
$69,559
$35,541
2008
$1,867,652
$392,513
$163,512
$116,813
$69,813
$35,340
2009
$1,469,393
$351,968
$157,342
$114,181
$68,216
$34,156
2010
$1,634,386
$369,691
$161,579
$116,623
$69,126
$34,338
2011
$1,717,675
$388,905
$167,728
$120,136
$70,492
$34,823
2012
$2,161,175
$434,682
$175,817
$125,195
$73,354
$36,055
2013
$1,860,848
$428,713
$179,760
$127,695
$74,955
$36,841
2014
$2,136,762
$465,626
$188,996
$133,445
$77,714
$38,173
Source: Internal Revenue Service.
Year
Total
Top 0.1%
Top 1%
Top 5%
Between 5% & 10%
Top 10%
Between 10% & 25%
Top 25%
Between 25% & 50%
Top 50%
Bottom 50%
Table 8. Average Tax Rate, 1980–2014 (Percent of AGI Paid in Income Taxes)
Source: Internal Revenue Service.
1980
15.31%
34.47%
26.85%
17.13%
23.49%
14.80%
19.72%
11.91%
17.29%
6.10%
1981
15.76%
33.37%
26.59%
18.16%
23.64%
15.53%
20.11%
12.48%
17.73%
6.62%
1982
14.72%
31.43%
25.05%
16.61%
22.17%
14.35%
18.79%
11.63%
16.57%
6.10%
1983
13.79%
30.18%
23.64%
15.54%
20.91%
13.20%
17.62%
10.76%
15.52%
5.66%
1984
13.68%
29.92%
23.42%
15.57%
20.81%
12.90%
17.47%
10.48%
15.35%
5.77%
1985
13.73%
29.86%
23.50%
15.69%
20.93%
12.83%
17.55%
10.41%
15.41%
5.70%
1986
14.54%
33.13%
25.68%
15.99%
22.64%
12.97%
18.72%
10.48%
16.32%
5.63%
The Tax Reform Act of 1986 changed the definition of AGI, so data above and below this line not strictly comparable
1987
13.12%
26.41%
22.10%
14.43%
19.77%
11.71%
16.61%
9.45%
14.60%
5.09%
1988
13.21%
24.04%
21.14%
14.07%
19.18%
11.82%
16.47%
9.60%
14.64%
5.06%
1989
13.12%
23.34%
20.71%
13.93%
18.77%
12.08%
16.27%
9.77%
14.53%
5.11%
1990
12.95%
23.25%
20.46%
13.63%
18.50%
12.01%
16.06%
9.73%
14.36%
5.01%
1991
12.75%
24.37%
20.62%
13.96%
18.63%
11.57%
15.93%
9.55%
14.20%
4.62%
1992
12.94%
25.05%
21.19%
13.99%
19.13%
11.39%
16.25%
9.42%
14.44%
4.39%
1993
13.32%
28.01%
22.71%
14.01%
20.20%
11.40%
16.90%
9.37%
14.90%
4.29%
1994
13.50%
28.23%
23.04%
14.20%
20.48%
11.57%
17.15%
9.42%
15.11%
4.32%
1995
13.86%
28.73%
23.53%
14.46%
20.97%
11.71%
17.58%
9.43%
15.47%
4.39%
1996
14.34%
28.87%
24.07%
14.74%
21.55%
11.86%
18.12%
9.53%
15.96%
4.40%
1997
14.48%
27.64%
23.62%
14.87%
21.36%
12.04%
18.18%
9.63%
16.09%
4.48%
1998
14.42%
27.12%
23.63%
14.79%
21.42%
11.63%
18.16%
9.12%
16.00%
4.44%
1999
14.85%
27.53%
24.18%
15.06%
21.98%
11.76%
18.66%
9.12%
16.43%
4.48%
2000
15.26%
27.45%
24.42%
15.48%
22.34%
12.04%
19.09%
9.28%
16.86%
4.60%
The IRS changed methodology, so data above and below this line not strictly comparable
2001
14.47%
28.17%
27.60%
23.91%
15.20%
21.68%
11.87%
18.35%
9.20%
16.08%
4.92%
2002
13.28%
28.48%
27.37%
23.17%
14.15%
20.76%
10.70%
17.23%
8.00%
14.87%
3.86%
2003
12.11%
24.60%
24.38%
20.92%
12.46%
18.70%
9.69%
15.57%
7.41%
13.53%
3.49%
2004
12.31%
23.06%
23.52%
20.83%
12.53%
18.80%
9.41%
15.71%
7.27%
13.68%
3.53%
2005
12.65%
22.48%
23.15%
20.93%
12.61%
19.03%
9.45%
16.04%
7.18%
14.01%
3.51%
2006
12.80%
21.94%
22.80%
20.80%
12.84%
19.02%
9.52%
16.12%
7.22%
14.12%
3.51%
2007
12.90%
21.42%
22.46%
20.66%
12.92%
18.96%
9.61%
16.16%
7.27%
14.19%
3.56%
2008
12.54%
22.67%
23.29%
20.83%
12.66%
18.87%
9.45%
15.85%
6.97%
13.79%
3.26%
2009
11.39%
24.28%
24.05%
20.59%
11.53%
18.19%
8.36%
14.81%
5.76%
12.61%
2.35%
2010
11.81%
22.84%
23.39%
20.64%
11.98%
18.46%
8.70%
15.22%
6.01%
13.06%
2.37%
2011
12.54%
22.82%
23.50%
20.89%
12.83%
18.85%
9.70%
15.82%
6.98%
13.76%
3.13%
2012
13.11%
21.67%
22.83%
20.97%
13.33%
19.21%
9.96%
16.35%
7.21%
14.33%
3.28%
2013
13.64%
27.91%
27.08%
23.20%
13.40%
20.75%
10.11%
17.28%
7.31%
14.98%
3.30%
2014
14.16%
27.67%
27.16%
23.61%
13.73%
21.25%
10.37%
17.83%
7.48%
15.52%
3.45%
For data prior to 2001, all tax returns that have a positive AGI are included, even those that do not have a positive income tax liability. For data from 2001 forward, returns with negative AGI are also included, but dependent returns are excluded.
Income tax after credits (the measure of “income taxes paid” above) does not account for the refundable portion of EITC. If it were included, the tax share of the top income groups would be higher. The refundable portion is classified as a spending program by the Office of Management and Budget and therefore is not included by the IRS in these figures.
The only tax analyzed here is the federal individual income tax, which is responsible for more than 25 percent of the nation’s taxes paid (at all levels of government). Federal income taxes are much more progressive than federal payroll taxes, which are responsible for about 20 percent of all taxes paid (at all levels of government), and are more progressive than most state and local taxes.
AGI is a fairly narrow income concept and does not include income items like government transfers (except for the portion of Social Security benefits that is taxed), the value of employer-provided health insurance, underreported or unreported income (most notably that of sole proprietors), income derived from municipal bond interest, net imputed rental income, and others.
The unit of analysis here is that of the tax return. In the figures prior to 2001, some dependent returns are included. Under other units of analysis (like the Treasury Department’s Family Economic Unit), these returns would likely be paired with parents’ returns.
These figures represent the legal incidence of the income tax. Most distributional tables (such as those from CBO, Tax Policy Center, Citizens for Tax Justice, the Treasury Department, and JCT) assume that the entire economic incidence of personal income taxes falls on the income earner.
[3] There is strong reason to believe that capital gains realizations were unusually depressed in 2013, due to the increase in the top capital gains tax rate from 15 percent to 23.8 percent. In 2013, capital gains accounted for 26.6 percent of the income of taxpayers with over $1 million in AGI received, compared to 31.7 percent in 2014 (these calculations apply for net capital gains reported on Schedule D). Table 1.4, Publication 1304, “Individual Income Tax Returns 2014,” Internal Revenue Service, https://www.irs.gov/uac/soi-tax-stats-individual-income-tax-returns-publication-1304-complete-report.
[4] Here, “average income tax rate” is defined as income taxes paid divided by adjusted gross income.
Vice President Mike Pence, wearing a brown suit and his usual earnest expression, was far from the fray last week, here at a warehouse outside Cleveland amid metal rods and wooden crates for a “listening session” with small-business owners. Sitting at a drafting table, he ignored the camera lights as well as the trouble in Washington, dutifully hearing out complaints about healthcare, taking notes on a legal pad and promising the Ohioans that the Trump-Pence administration was close to replacingObamacare.
This is how Mike Pence copes with the drama that defines life as Donald Trump’s sidekick: acting like everything is normal, boringly normal.
It requires a measure of willful disbelief, some salesmanship and a heap of praise for the president. But that coping strategy does not mask the fundamental challenge of Pence’s role since he became Trump’s running mate nearly a year ago: balancing his own reputation and political ambition against his loyalty to a man seemingly determined to scorch nearly every norm in Washington, and now enmeshed in a special counsel investigation in large part due to his own erratic behavior.
The vice president has made his choice, hitching his career to Trump’s unpredictable presidency, but lately he also has made a few notable moves toward protecting himself, hiring a personal attorney and establishing an independent political committee.
“It’s kind of perilous — skiing through moguls,” said Brian Howey, an Indiana political blogger who has chronicled Pence’s career from U.S. House member to Indiana governor to vice president. “How many times can you do that before you’re ensnarled in the web of deception?”
Friends say there is nothing to game out in Pence’s allegiance to Trump. Pence believes in the president, they say, and agrees with supporters who believe the White House is under unfairly harsh scrutiny.
“What would happen if suddenly we found Trump is setting fire to the Humane Society?” said Greg Garrison, a conservative former radio host in Indiana who has long known Pence, choosing an absurd example to make the point that Trump’s recklessness has been exaggerated. “Does that mean Mike is going to go along? No, he’s not. But I think Mike is where he is because he understands this president and where we are right now.”
Yet just five months in, some observers say Pence’s chosen course as the captain of Trump’s cheering section has diminished his own gravitas and dashed the hopes of mainstream Republicans who thought Pence could serve as a check on the impulsive Trump.
“Recent vice presidents have been supportive of the president without surrendering a sense of personal dignity, without saying stuff that just doesn’t pass the straight-face test,” said Joel K. Goldstein, a St. Louis University law professor who has written about the modern vice presidency and its enhanced power.
For a parallel, Goldstein reached not to a vice president but to a well-known aide to President Lyndon B. Johnson, Jack Valenti, who was mocked for his over-the-top praise of his boss. Valenti, Goldstein said, is the only public figure in the modern era that came close to Pence’s level of presidential puffery.
What is more, Goldstein added, any notion that Pence’s power would be enhanced by his governing experience relative to the inexperienced Trump has been undermined by the sense that Pence lacks the standing to “go in with Trump and level with him on things.”
While Pence is often in the room with Trump and speaks with him nearly every day, he does not always command the president’s attention. That dynamic was evident during the first Cabinet meeting last month. Trump swiveled his head around the room and asked, “Where is our vice president?”
Pence sat right in front of him.
When the president finally spied his top deputy, Pence knew just what to say.
“The greatest privilege of my life is to serve as the — as vice president to the president who’s keeping his word to the American people and assembling a team that’s bringing real change, real prosperity, real strength back to our nation,” Pence said.
Taking their cue from Pence, the Cabinet secretaries then took turns extolling the president in ways that were widely derided as obsequious.
But for Pence, such flattery has come to define his persona. Variations on the line that serving Trump is “the greatest privilege of my life” are part of his stump speech, used among audiences as varied as Cuban Americans in Miami, evangelicals in Washington, troops in Honolulu, Japan and South Korea, and, last week, the factory workers in Ohio.
The younger Pence, with his square features, silver hair and wholesome rhetorical style, suggests a measured 1950s television dad, and as such stands in contrast to a president who developed his celebrity in the 21st century world of social media and reality television. His political discipline also contrasts with Trump’s extemporaneous politics.
As governor of Indiana, Pence was seen as a potential presidential candidate by many Republicans, at least until his popularity waned significantly. Certainly he was seen before the 2016 campaign as a more serious possibility than Trump. Pence is, in many ways, the type of establishment-blessed figure Trump ran against when he pledged to wrest power from career politicians.
But Pence came to see himself as Trump did, less as a contrast to the maverick mogul than as a complement.
“You don’t win six congressional elections and a gubernatorial election and a national ticket without having a sense of politics and self-preservation,” said Rep. Tom Cole, an Oklahoma Republican who served with Pence in the House leadership.
For Pence the key to melding Trump’s interests with his own, Cole said, is making clear that he’s only as valuable to the president as his reputation. “It doesn’t help him if he loses his credibility,” Cole said.
Pence has skirted that danger since his first month in office.
Though he led Trump’s presidential transition, Pence has said he did not know about meetings between Russian officials and Michael Flynn, Trump’s national security advisor during the campaign and initially in the White House, that are now central to the investigation into possible collusion to influence the 2016 election. So in January, on Flynn’s assurance, he falsely said on television that Flynn had not discussed with Russian Ambassador Sergey Kislyak the sanctions that President Obama imposed in December as penalty for Russia’s campaign meddling.
Flynn’s lying to the vice president was the reason given for his forced resignation, yet Trump and several advisors had been aware of Flynn’s deception for days.
Pence also said he did not know Flynn was secretly lobbying for Turkey until March, though Flynn, according to the New York Times, informed the transition team in early January that he was under investigation for failing to report the work he did as a foreign agent during the campaign.
And after Trump fired FBI Director James B. Comey, Pence insisted that the bureau’s Russia investigation had nothing to do with it, only to have Trump contradict him a day later in a nationally televised interview.
The incidents underscore Pence’s problem: His allies maintain he is a core inside player, yet at significant moments, they have insisted he was out of the loop. The friends dismiss such embarrassments, however, as the natural consequence of Trump being Trump, and Pence’s place as first in line whether the White House is on offense or defense.
“He understands he has a job and his job is to be a loyal soldier, and he’s a very effective communicator,” said Pete Seat, an official with the Indiana Republican Party. “So sometimes the job of being first one out of the gate falls on him.”
David McIntosh, the Indiana Republican whom Pence replaced in Congress, said “there were two truths” in the Comey firing. There was the one Pence told — that Justice Department leaders recommended Comey be fired — and the one that Trump later told, that he would have fired Comey regardless of that recommendation.
“One thing I think Mike would not do is make the first statement if he thought it was not true,” said McIntosh, disregarding Pence’s insistence that Comey’s firing had nothing to do with the Russia investigation when Trump later said it did.
Pence, who turned 58 last month, came to prominence in Indiana as a talk radio host in the 1990s, building a brand as a conservative Christian who chose to make his points without turning up the volume.
Elected to Congress on his third try, Pence initially was a conservative renegade. But he proved to be in the vanguard of what became the tea party movement. Sen. Jeff Flake, an Arizona Republican whose office was next to Pence’s when the Indianan was in Congress, remembers the two of them bursting through the House doors together on late nights — like Butch Cassidy and the Sundance Kid into a saloon — to halt spending measures, and offering slow claps for President George W. Bush’s spending plans during a State of the Union address.
Flake said Pence’s ability to stay relentlessly on message endeared him to other conservatives, propelling him into the House leadership ranks.
Next, as Indiana’s governor for four years, he built on his conservative credentials while showing a willingness to bend on a few issues, including allowing expansion of Medicaid as part of Obamacare. He suffered his biggest setback on a religious liberty bill that allowed store owners to refuse services for gay weddings; Pence retreated under pressure from groups concerned the law would hurt Indiana’s reputation and its ability to recruit workers and businesses from out of state.
Pence’s allies say he has maintained important credibility in Congress, both because he served there and because of his alliance with House Speaker Paul D. Ryan. He was influential as Trump made his Cabinet choices and enlisted Judge Neil M. Gorsuch for the Supreme Court, a selection that united Republicans more than any decision Trump has made in the White House. But his role as a conduit to Congress is being tested by Republicans’ divisions over the healthcare bill, which Pence has repeatedly promised would get out of Congress by the end of summer.
Pence, through his press office, declined an interview request, citing his desire to avoid discussing his role or influence. He has been careful to avoid taking credit, an important trait to a president who wants it for himself and is angered by those who flaunt their influence. If the vice president has had any disagreements with Trump, they have not been leaked, a rarity in the White House.
Pence associates say he is most comfortable in the policy realm, letting Trump pick his tasks and define his role. That has included trips to Asia and Europe and another planned for Latin America in August. By sticking to script and avoiding free-form interactions with the press, Pence has avoided getting dragged further into controversies over the Russia investigation and Trump’s tweets.
As Comey testified in Congress last month that the president lied and tried to halt the investigations of Flynn and Russia, Pence once again found a spot for himself away from the tumult.
Before an ornate room full of governors and state officials near the White House, Pence focused on the administration’s theme of the week: roads, bridges and airports. He spoke about the “builder in the White House,” even as Trump himself had overshadowed that message with tweets assailing the mayor of London, the media and his Justice Department.
“Folks,” Pence said, “it’s already been a banner week for infrastructure.”
The Pronk Pops blog is the broadcasting and mass communication of ideas about life, liberty, and the pursuit of happiness, prosperity, truth, virtue and wisdom.


 hen in the Course of human events it becomes necessary for one people to dissolve the political bands which have connected them with another and to assume among the powers of the earth, the separate and equal station to which the Laws of Nature and of Nature’s God entitle them, a decent respect to the opinions of mankind requires that they should declare the causes which impel them to the separation.


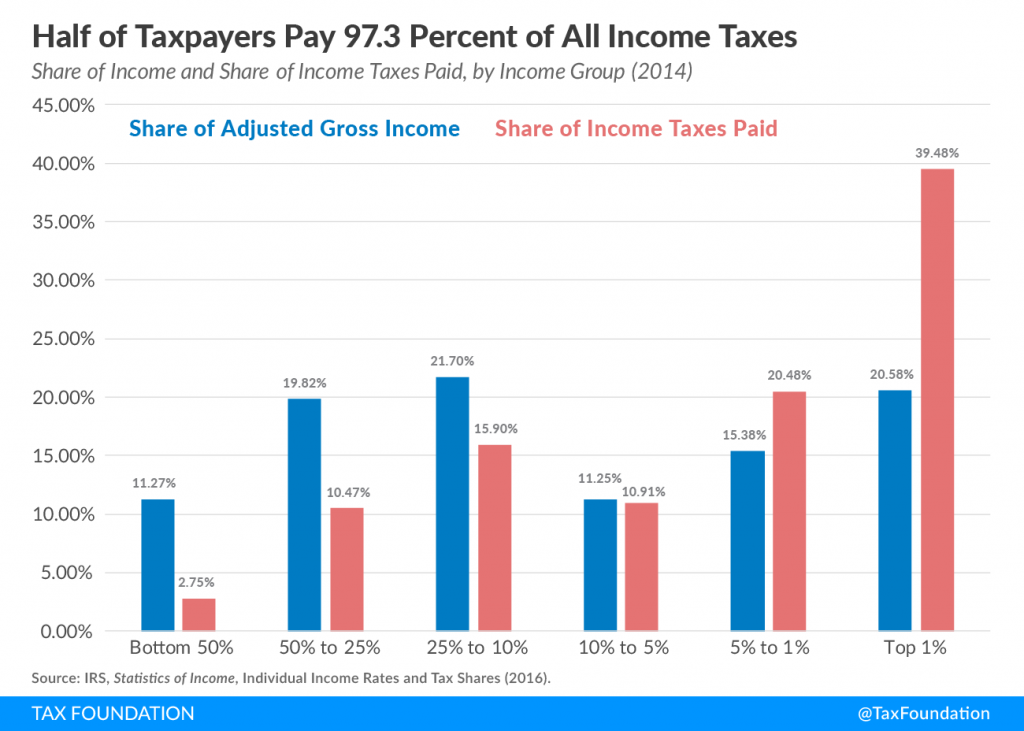


You must be logged in to post a comment.