The Pronk Pops Show 757, September 16, 2016, Story 1: Dissecting Trump’s Economic Plan — Right Direction But Huge Missed Opportunity To Change From Income To Consumption Based Taxation (Fair Tax Less) — Absolutely No Details As To When and How The U.S. Federal Budget Will Be Balanced And The National Debt and Unpaid Liabilities Will Be Paid Down– Growth Is The Answer Provided Government Spending Is Cut By $500 Billion Per Year Not $100 Billion — Kicking The Can Down The Road To 2030 When Debt Bomb Explodes As All The Baby Boomers Become Eligible And Collect Social Security and Medicare Entitlement Benefits! — Videos

The Pronk Pops Show Podcasts
Pronk Pops Show 757: September 16, 2016
Pronk Pops Show 756: September 15, 2016
Pronk Pops Show 755: September 14, 2016
Pronk Pops Show 754: September 13, 2016
Pronk Pops Show 753: September 12, 2016
Pronk Pops Show 752: September 9, 2016
Pronk Pops Show 751: September 8, 2016
Pronk Pops Show 750: September 7, 2016
Pronk Pops Show 749: September 2, 2016
Pronk Pops Show 748: September 1, 2016
Pronk Pops Show 747: August 31, 2016
Pronk Pops Show 746: August 30, 2016
Pronk Pops Show 745: August 29, 2016
Pronk Pops Show 744: August 26, 2016
Pronk Pops Show 743: August 25, 2016
Pronk Pops Show 742: August 24, 2016
Pronk Pops Show 741: August 23, 2016
Pronk Pops Show 740: August 22, 2016
Pronk Pops Show 739: August 18, 2016
Pronk Pops Show 738: August 17, 2016
Pronk Pops Show 737: August 16, 2016
Pronk Pops Show 736: August 15, 2016
Pronk Pops Show 735: August 12, 2016
Pronk Pops Show 734: August 11, 2016
Pronk Pops Show 733: August 9, 2016
Pronk Pops Show 732: August 8, 2016
Pronk Pops Show 731: August 4, 2016
Pronk Pops Show 730: August 3, 2016
Pronk Pops Show 729: August 1, 2016
Pronk Pops Show 728: July 29, 2016
Pronk Pops Show 727: July 28, 2016
Pronk Pops Show 726: July 27, 2016
Pronk Pops Show 725: July 26, 2016
Pronk Pops Show 724: July 25, 2016
Pronk Pops Show 723: July 22, 2016
Pronk Pops Show 722: July 21, 2016
Pronk Pops Show 721: July 20, 2016
Pronk Pops Show 720: July 19, 2016
Pronk Pops Show 719: July 18, 2016
Pronk Pops Show 718: July 15, 2016
Pronk Pops Show 717: July 14, 2016
Pronk Pops Show 716: July 13, 2016
Pronk Pops Show 715: July 12, 2016
Pronk Pops Show 714: July 7, 2016
Pronk Pops Show 713: July 6, 2016
Pronk Pops Show 712: July 5, 2016
Pronk Pops Show 711: July 1, 2016
Pronk Pops Show 710: June 30, 2016
Pronk Pops Show 709: June 29, 2016
Pronk Pops Show 708: June 28, 2016
Pronk Pops Show 707: June 27, 2016
Pronk Pops Show 706: June 24, 2016
Pronk Pops Show 705: June 23, 2016
Pronk Pops Show 704: June 22, 2016
Pronk Pops Show 703: June 21, 2016
Pronk Pops Show 702: June 20, 2016
Pronk Pops Show 701: June 17, 2016
Pronk Pops Show 700: June 16, 2016
Pronk Pops Show 699: June 15, 2016
Pronk Pops Show 698: June 14, 2016
Pronk Pops Show 697: June 13, 2016
Pronk Pops Show 696: June 10, 2016
Pronk Pops Show 695: June 9, 2016
Pronk Pops Show 694: June 8, 2016
Pronk Pops Show 693: June 6, 2016
Pronk Pops Show 692: June 3, 2016
Pronk Pops Show 691: June 2, 2016
Pronk Pops Show 690: June 1, 2016
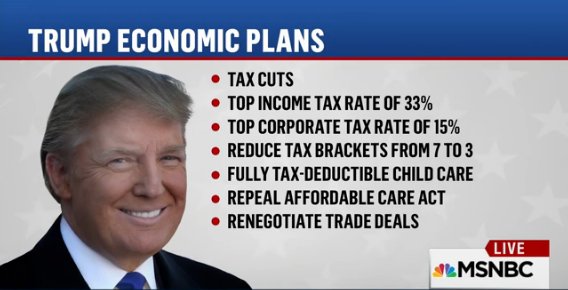
Story 1: Dissecting Trump’s Economic Plan — Right Direction But Huge Missed Opportunity To Change From Income To Consumption Based Taxation (Fair Tax Less) — Absolutely No Details As To When and How The U.S. Federal Budget Will Be Balanced And The National Debt and Unpaid Liabilities Will Be Paid Down– Growth Is The Answer Provided Government Spending Is Cut By $500 Billion Per Year Not $100 Billion — Kicking The Can Down The Road To 2030 When Debt Bomb Explodes As All The Baby Boomers Become Eligible And Collect Social Security and Medicare Entitlement Benefits! — Videos
U.S. Debt Clock.org
http://www.usdebtclock.org/
For Fiscal Year 2016
513,662,000,000 Budget Deficit Through July 2016


Fiscal Year 2015

What are the Federal Budget Actuals for FY 2015?
From US Treasury Monthly Report for September 2015.
Total Federal Outlays: $3.69 trillion
Total Federal Receipts: $3.25 trillion
Federal Deficit: $438 billion
Total Federal Debt: $18.1 trillion
Details of Budgeted vs. Actual Outlays for FY 2015

The bar chart comes directly from the Monthly Treasury Statement published by the U. S. Treasury Department.<—- Click on the chart for more info.
The “Debt Total” bar chart is generated from the Treasury Department’s “Debt Report” found on the Treasury Direct web site. It has links to search the debt for any given date range, and access to debt interest information. It is a direct source to government provided budget information.
- About Tax Code and the IRS.
— “Deficit” vs. “Debt”—
Suppose you spend more money this month than your income. This situation is called a “budget deficit”. So you borrow (ie; use your credit card). The amount you borrowed (and now owe) is called your debt. You have to pay interest on your debt. If next month you spend more than your income, another deficit, you must borrow some more, and you’ll still have to pay the interest on your debt (now larger). If you have a deficit every month, you keep borrowing and your debt grows. Soon the interest payment on your loan is bigger than any other item in your budget. Eventually, all you can do is pay the interest payment, and you don’t have any money left over for anything else. This situation is known as bankruptcy.
| “Reducing the deficit” is a meaningless soundbite. If theDEFICIT is any amount more than ZERO, we have to borrow more and the DEBT grows. |
Each year since 1969, Congress has spent more money than its income. The Treasury Department has to borrow money to meet Congress’s appropriations. Here is a direct link to the Congressional Budget Office web site. Check out the CBO’s assessment of the Debt. We have to pay interest* on that huge, growing debt; and it dramatically cuts into our budget.


http://federalbudgetinpictures.com/unsustainable-budget-deficits/

http://federalbudgetinpictures.com/where-does-all-the-money-go/


http://federalbudgetinpictures.com/revenue-sources/


http://federalbudgetinpictures.com/how-the-budget-has-changed/

http://federalbudgetinpictures.com/entitlements-to-consume-all-taxes/

ttp://federalbudgetinpictures.com/social-security-recipient-worker-ratio/


Dissecting Donald Trump’s economic plan
Donald Trump’s Economic Plan – Cashin’ In
Economic Outlook – Trump Outlines Plan For Growth – Journal Editorial Report
Donald Trump Economic Club of New York Event [ AMAZING ]
Donald Trump Answers Questions at Economic Club of New York
‘Trump doubling down on the American worker’ – GOP strategist
Dissecting Donald Trump’s economic plan
Breaking down Trump’s economic plan
Trump economic advisor breaks down Trump’s tax plan
Trump pitches economic plan
Welch responds to Mark Cuban, talks Trump’s economic plan
EAT THE RICH!
Do the Rich Pay Their Fair Share?
Bill Gates: Don’t tax my income, tax my consumption
Bill Gates: A conversation on poverty and prosperity
The Rich Are Taxed Enough- Debate -Intelligence Squared U.S.
FairTax: Fire Up Our Economic Engine (Official HD)
Rep. Woodall Discusses FairTax with Colleagues on House Floor
Rep. Woodall Discusses Nation’s Fiscal Issues on House Floor
FAIRtax-What is It? Replaces income tax and payroll tax with sales tax
Q&A on the FAIRTAX pt.1
Q&A on the FAIRTAX pt.2
FairTax Prebate Explained
The FairTax: It’s Time
Pence on the Fair Tax
Freedom from the IRS! – FairTax Explained in Detail
Freedom from the IRS! – FairTax Explained in Detail
John Stossel Inconvenient Taxes Part 1 of 5
John Stossel Inconvenient Taxes Part 2 of 5
John Stossel Inconvenient Taxes Part 3 of 5
John Stossel Inconvenient Taxes Part 4 of 5
John Stossel Inconvenient Taxes Part 5 of 5
A Blueprint for Balance


Which takes up a greater percentage of the federal budget — national defense or entitlements such as Social Security and Medicare?
Even if you picked the right answer (entitlements), you may be surprised by the gap between the two. National defense accounts for 16 percent of the federal budget. Entitlements? 52 percent.
Social Security alone dwarfs defense spending, taking up 24 percent. That’s right: One out of every four dollars spent at the national level goes toward the mammoth New Deal program. Medicare, Medicaid and other health care spending gets 28 percent of every federal dollar.
This is just one of the facts you can learn at a glance in FederalBudgetInPictures.com. You’ll find plenty of charts there to put the fiscal debate into sharper focus.
Not that you’ll necessarily enjoy getting a more accurate perspective on our nation’s spending. The “U.S. Budget vs. Family Budget” chart is particularly startling: “If a median-income American family spent money like the U.S. government, it would have spent all of its earnings, and then put $7,000 on the credit card in 2015, even though it was already $260,000 in debt.”
How often, when we hear news about Congress and the budget, do terms like “deficit spending” just wash over us, the numbers too big to comprehend, the terms too vague to have any real meaning? And yet, that’s our money that they’re mishandling. That’s our children’s future they’re mortgaging. Do we care?
A child born this year will have a $42,000 share of publicly held federal debt. That’s up from less than $10,000 for a child born in 1970. And the 2016 child, at current rates of spending, will see that debt climb to $68,454 by the time he’s 18, then hit $116,904 by the time he’s 34 (in 2050). This is unsustainable.
Speaking of unsustainable, another chart shows that we’re on pace for entitlement spending and interest on the debt to consume every dime of tax revenue by 2033. That’s right. By then, everything the federal government takes in via taxes will go toward Social Security, Medicare, Medicaid and other health care programs, along with the net interest on the massive national debt.
Worse, this is all set to happen automatically. Another chart, “Autopilot Spending Devours Budget,” shows why: “Congress only appropriates funds for the discretionary portion of the budget on an annual basis. Autopilot spending makes up more than two-thirds of the budget and is growing rapidly.”
So even if you vote in a fiscal hawk from your congressional district, and he sincerely tries to get spending under control, there’s only so much he can do. Absent a true overhaul, we’re headed toward a fiscal cliff — and the brakes are gone.
No problem, some people say. We just need to tax the rich more. Get those fat cats to cough up some extra dough, and we’ll be set.
Good luck with that. The federal income tax system is already highly progressive. In 2012 (the latest year with available data), the top 10 percent of income earners earned 48 percent of all income and paid 70 percent of all federal income taxes. How much more can we bleed the golden goose before it’s dead?
OK, some may reply, then we just need to raise taxes on corporations. Sorry: Among developed nations, the United States has the highest corporate tax rate, at 39 percent. That’s substantially higher than that of other global regional leaders, such as Canada (26.3 percent), Chile (22.5 percent) and Hong Kong (16.5 percent).
That doesn’t mean we have to despair. It won’t be easy, but the problem can be fixed. By creating a budget that restores fiscal responsibility, we can not only balance the budget, we can create surpluses to reduce the national debt. Heritage has already outlined such a plan, in detail, in its “Blueprint for Balance.”
We don’t tolerate fiscal irresponsibility at home. Why should we put up with it in Washington?
http://www.heritage.org/research/commentary/2016/6/a-blueprint-for-balance
Summary of the Latest Federal Income Tax Data, 2015 Update
The Internal Revenue Service has recently released new data on individual income taxes for calendar year 2013, showing the number of taxpayers, adjusted gross income, and income tax shares by income percentiles.[1]
The data demonstrates that the U.S. individual income tax continues to be progressive, borne mainly by the highest income earners.
Key Findings
- In 2013, 138.3 million taxpayers reported earning $9.03 trillion in adjusted gross income and paid $1.23 trillion in income taxes.
- Every income group besides the top 1 percent of taxpayers reported higher income in 2013 than the previous year. All income groups paid higher taxes in 2013 than the previous year.
- The share of income earned by the top 1 percent of taxpayers fell to 19.0 percent in 2013. Their share of federal income taxes fell slightly to 37.8 percent.
- In 2012, the top 50 percent of all taxpayers (69.2 million filers) paid 97.2 percent of all income taxes while the bottom 50 percent paid the remaining 2.8 percent.
- The top 1 percent (1.3 million filers) paid a greater share of income taxes (37.8 percent) than the bottom 90 percent (124.5 million filers) combined (30.2 percent).
- The top 1 percent of taxpayers paid a higher effective income tax rate than any other group, at 27.1 percent, which is over 8 times higher than taxpayers in the bottom 50 percent (3.3 percent).
Reported Income Decreased in 2013, but Taxes Increase
Taxpayers reported $9.03 trillion in adjusted gross income (AGI) on 138.3 million tax returns in 2013. While the U.S. economy grew in 2013, total AGI fell by $8 billion from 2012 levels. Furthermore, there were 2.2 million more returns filed in 2013 than 2012, meaning that average AGI fell by $1,131 per return.
The most likely explanation behind lower AGI in 2013 is unusually high capital gains realizations in 2012.[2] Because the top tax rate on long-term capital gains and qualified dividends was set to rise from 15 percent to 23.8 percent in 2013, many high-income Americans realized their capital gains in 2012, to take advantage of low tax rates. As capital gains realizations fell to normal levels in 2013, overall AGI decreased. Accordingly, only the top 1 percent of taxpayers saw a decrease in income in 2013; all other groups saw their income increase.
Despite the decrease in overall income reported, taxes paid increased by $46 billion to $1.232 trillion in 2013. Taxes paid increased for all income groups.
The share of income earned by the top 1 percent fell to 19.04 percent of total AGI, down from 21.86 percent in 2012. The share of the income tax burden for the top 1 percent also fell slightly, from 38.09 percent in 2012 to 37.80 percent in 2013.
| Table 1. Summary of Federal Income Tax Data, 2013 | |||||||
| Number of Returns* | AGI ($ millions) | Income Taxes Paid ($ millions) | Group’s Share of Total AGI | Group’s Share of Income Taxes | Income Split Point | Average Tax Rate | |
| All Taxpayers | 138,313,155 | $9,033,840 | $1,231,911 | 100.00% | 100.00% | ||
| Top 1% | 1,383,132 | $1,719,794 | $465,705 | 19.04% | 37.80% | $428,713 | 27.08% |
| 1-5% | 5,532,526 | $1,389,594 | $255,537 | 15.38% | 20.74% | 18.39% | |
| Top 5% | 6,915,658 | $3,109,388 | $721,242 | 34.42% | 58.55% | $179,760 | 23.20% |
| 5-10% | 6,915,658 | $1,034,110 | $138,621 | 11.45% | 11.25% | 13.40% | |
| Top 10% | 13,831,316 | $4,143,498 | $859,863 | 45.87% | 69.80% | $127,695 | 20.75% |
| 10-25% | 20,746,973 | $2,008,180 | $202,935 | 22.23% | 16.47% | 10.11% | |
| Top 25% | 34,578,289 | $6,151,678 | $1,062,798 | 68.10% | 86.27% | $74,955 | 17.28% |
| 25-50% | 34,578,289 | $1,843,925 | $134,805 | 20.41% | 10.94% | 7.31% | |
| Top 50% | 69,156,578 | $7,995,603 | $1,197,603 | 88.51% | 97.22% | $36,841 | 14.98% |
| Bottom 50% | 69,156,578 | $1,038,237 | $34,307 | 11.49% | 2.78% | $36,841 | 3.30% |
| *Does not include dependent filers. | |||||||
Source: Internal Revenue Service.
High-Income Americans Paid the Majority of Federal Taxes
In 2013, the bottom 50 percent of taxpayers (those with AGIs below $36,841) earned 11.49 percent of total AGI. This group of taxpayers paid approximately $34 billion in taxes, or 2.78 percent of all income taxes in 2013.
In contrast, the top 1 percent of all taxpayers (taxpayers with AGIs of $428,713 and above), earned 19.04 percent of all AGI in 2013, but paid 37.80 percent of all federal income taxes.
In 2013, the top 1 percent of taxpayers accounted for more income taxes paid than the bottom 90 percent combined. The top 1 percent of taxpayers paid $465 billion, or 37.80 percent of all income taxes, while the bottom 90 percent paid $372 billion, or 30.20 percent of all income taxes.
Chart 1.

High-Income Taxpayers Pay the Highest Average Tax Rates
The 2013 IRS data shows that taxpayers with higher incomes pay much higher average income tax rates than lower-income taxpayers.
The bottom 50 percent of taxpayers (taxpayers with AGIs below $36,841) faced an average income tax rate of 3.3 percent. Other taxpayers face much higher rates: for example, taxpayers with AGIs between the 10th and 5th percentile ($127,695 and $179,760) pay an average effective rate of 13.4 percent – four times the rate paid by those in the bottom 50 percent.
The top 1 percent of taxpayers (AGI of $428,713 and above) paid the highest effective income tax rate at 27.1 percent, 8.19 times the rate faced by the bottom 50 percent of taxpayers.
Chart 2.

Taxpayers at the very top of the income distribution, the top 0.1 percent (with AGIs over $1.86 million), paid an even higher average tax rate, of 27.9 percent.
The average tax rate of the top 1 percent of taxpayers rose significantly in 2013, from 21.9 percent in 2012 to 27.1 percent in 2013. This increase in the average tax rate of the 1 percent was largely due to several changes to the federal tax code, imposed at the end of 2012 as part of the “fiscal cliff” tax deal: a new 39.6 percent income tax bracket, a higher top rate on capital gains and dividends, and the reintroduction of the Pease limitation on itemized deductions.[3]
Appendix
| Table 2. Number of Federal Individual Income Tax Returns Filed, 1980–2013 (in thousands) | |||||||||||
| Year | Total | Top 0.1% | Top 1% | Top 5% | Between 5% & 10% | Top 10% | Between 10% & 25% | Top 25% | Between 25% & 50% | Top 50% | Bottom 50% |
| 1980 | 93,239 | 932 | 4,662 | 4,662 | 9,324 | 13,986 | 23,310 | 23,310 | 46,619 | 46,619 | |
| 1981 | 94,587 | 946 | 4,729 | 4,729 | 9,459 | 14,188 | 23,647 | 23,647 | 47,293 | 47,293 | |
| 1982 | 94,426 | 944 | 4,721 | 4,721 | 9,443 | 14,164 | 23,607 | 23,607 | 47,213 | 47,213 | |
| 1983 | 95,331 | 953 | 4,767 | 4,767 | 9,533 | 14,300 | 23,833 | 23,833 | 47,665 | 47,665 | |
| 1984 | 98,436 | 984 | 4,922 | 4,922 | 9,844 | 14,765 | 24,609 | 24,609 | 49,218 | 49,219 | |
| 1985 | 100,625 | 1,006 | 5,031 | 5,031 | 10,063 | 15,094 | 25,156 | 25,156 | 50,313 | 50,313 | |
| 1986 | 102,088 | 1,021 | 5,104 | 5,104 | 10,209 | 15,313 | 25,522 | 25,522 | 51,044 | 51,044 | |
| The Tax Reform Act of 1986 changed the definition of AGI, so data above and below this line are not strictly comparable. | |||||||||||
| 1987 | 106,155 | 1,062 | 5,308 | 5,308 | 10,615 | 15,923 | 26,539 | 26,539 | 53,077 | 53,077 | |
| 1988 | 108,873 | 1,089 | 5,444 | 5,444 | 10,887 | 16,331 | 27,218 | 27,218 | 54,436 | 54,436 | |
| 1989 | 111,313 | 1,113 | 5,566 | 5,566 | 11,131 | 16,697 | 27,828 | 27,828 | 55,656 | 55,656 | |
| 1990 | 112,812 | 1,128 | 5,641 | 5,641 | 11,281 | 16,922 | 28,203 | 28,203 | 56,406 | 56,406 | |
| 1991 | 113,804 | 1,138 | 5,690 | 5,690 | 11,380 | 17,071 | 28,451 | 28,451 | 56,902 | 56,902 | |
| 1992 | 112,653 | 1,127 | 5,633 | 5,633 | 11,265 | 16,898 | 28,163 | 28,163 | 56,326 | 56,326 | |
| 1993 | 113,681 | 1,137 | 5,684 | 5,684 | 11,368 | 17,052 | 28,420 | 28,420 | 56,841 | 56,841 | |
| 1994 | 114,990 | 1,150 | 5,749 | 5,749 | 11,499 | 17,248 | 28,747 | 28,747 | 57,495 | 57,495 | |
| 1995 | 117,274 | 1,173 | 5,864 | 5,864 | 11,727 | 17,591 | 29,319 | 29,319 | 58,637 | 58,637 | |
| 1996 | 119,442 | 1,194 | 5,972 | 5,972 | 11,944 | 17,916 | 29,860 | 29,860 | 59,721 | 59,721 | |
| 1997 | 121,503 | 1,215 | 6,075 | 6,075 | 12,150 | 18,225 | 30,376 | 30,376 | 60,752 | 60,752 | |
| 1998 | 123,776 | 1,238 | 6,189 | 6,189 | 12,378 | 18,566 | 30,944 | 30,944 | 61,888 | 61,888 | |
| 1999 | 126,009 | 1,260 | 6,300 | 6,300 | 12,601 | 18,901 | 31,502 | 31,502 | 63,004 | 63,004 | |
| 2000 | 128,227 | 1,282 | 6,411 | 6,411 | 12,823 | 19,234 | 32,057 | 32,057 | 64,114 | 64,114 | |
| The IRS changed methodology, so data above and below this line are not strictly comparable. | |||||||||||
| 2001 | 119,371 | 119 | 1,194 | 5,969 | 5,969 | 11,937 | 17,906 | 29,843 | 29,843 | 59,685 | 59,685 |
| 2002 | 119,851 | 120 | 1,199 | 5,993 | 5,993 | 11,985 | 17,978 | 29,963 | 29,963 | 59,925 | 59,925 |
| 2003 | 120,759 | 121 | 1,208 | 6,038 | 6,038 | 12,076 | 18,114 | 30,190 | 30,190 | 60,379 | 60,379 |
| 2004 | 122,510 | 123 | 1,225 | 6,125 | 6,125 | 12,251 | 18,376 | 30,627 | 30,627 | 61,255 | 61,255 |
| 2005 | 124,673 | 125 | 1,247 | 6,234 | 6,234 | 12,467 | 18,701 | 31,168 | 31,168 | 62,337 | 62,337 |
| 2006 | 128,441 | 128 | 1,284 | 6,422 | 6,422 | 12,844 | 19,266 | 32,110 | 32,110 | 64,221 | 64,221 |
| 2007 | 132,655 | 133 | 1,327 | 6,633 | 6,633 | 13,265 | 19,898 | 33,164 | 33,164 | 66,327 | 66,327 |
| 2008 | 132,892 | 133 | 1,329 | 6,645 | 6,645 | 13,289 | 19,934 | 33,223 | 33,223 | 66,446 | 66,446 |
| 2009 | 132,620 | 133 | 1,326 | 6,631 | 6,631 | 13,262 | 19,893 | 33,155 | 33,155 | 66,310 | 66,310 |
| 2010 | 135,033 | 135 | 1,350 | 6,752 | 6,752 | 13,503 | 20,255 | 33,758 | 33,758 | 67,517 | 67,517 |
| 2011 | 136,586 | 137 | 1,366 | 6,829 | 6,829 | 13,659 | 20,488 | 34,146 | 34,146 | 68,293 | 68,293 |
| 2012 | 136,080 | 136 | 1,361 | 6,804 | 6,804 | 13,608 | 20,412 | 34,020 | 34,020 | 68,040 | 68,040 |
| 2013 | 138,313 | 138 | 1,383 | 6,916 | 6,916 | 13,831 | 20,747 | 34,578 | 34,578 | 69,157 | 69,157 |
| Source: Internal Revenue Service. | |||||||||||
| Table 3. Adjusted Gross Income of Taxpayers in Various Income Brackets, 1980–2013 (in Billions of Dollars) | |||||||||||
| Year | Total | Top 0.1% | Top 1% | Top 5% | Between 5% & 10% | Top 10% | Between 10% & 25% | Top 25% | Between 25% & 50% | Top 50% | Bottom 50% |
| 1980 | $1,627 | $138 | $342 | $181 | $523 | $400 | $922 | $417 | $1,339 | $288 | |
| 1981 | $1,791 | $149 | $372 | $201 | $573 | $442 | $1,015 | $458 | $1,473 | $318 | |
| 1982 | $1,876 | $167 | $398 | $207 | $605 | $460 | $1,065 | $478 | $1,544 | $332 | |
| 1983 | $1,970 | $183 | $428 | $217 | $646 | $481 | $1,127 | $498 | $1,625 | $344 | |
| 1984 | $2,173 | $210 | $482 | $240 | $723 | $528 | $1,251 | $543 | $1,794 | $379 | |
| 1985 | $2,344 | $235 | $531 | $260 | $791 | $567 | $1,359 | $580 | $1,939 | $405 | |
| 1986 | $2,524 | $285 | $608 | $278 | $887 | $604 | $1,490 | $613 | $2,104 | $421 | |
| The Tax Reform Act of 1986 changed the definition of AGI, so data above and below this line are not strictly comparable. | |||||||||||
| 1987 | $2,814 | $347 | $722 | $316 | $1,038 | $671 | $1,709 | $664 | $2,374 | $440 | |
| 1988 | $3,124 | $474 | $891 | $342 | $1,233 | $718 | $1,951 | $707 | $2,658 | $466 | |
| 1989 | $3,299 | $468 | $918 | $368 | $1,287 | $768 | $2,054 | $751 | $2,805 | $494 | |
| 1990 | $3,451 | $483 | $953 | $385 | $1,338 | $806 | $2,144 | $788 | $2,933 | $519 | |
| 1991 | $3,516 | $457 | $943 | $400 | $1,343 | $832 | $2,175 | $809 | $2,984 | $532 | |
| 1992 | $3,681 | $524 | $1,031 | $413 | $1,444 | $856 | $2,299 | $832 | $3,131 | $549 | |
| 1993 | $3,776 | $521 | $1,048 | $426 | $1,474 | $883 | $2,358 | $854 | $3,212 | $563 | |
| 1994 | $3,961 | $547 | $1,103 | $449 | $1,552 | $929 | $2,481 | $890 | $3,371 | $590 | |
| 1995 | $4,245 | $620 | $1,223 | $482 | $1,705 | $985 | $2,690 | $938 | $3,628 | $617 | |
| 1996 | $4,591 | $737 | $1,394 | $515 | $1,909 | $1,043 | $2,953 | $992 | $3,944 | $646 | |
| 1997 | $5,023 | $873 | $1,597 | $554 | $2,151 | $1,116 | $3,268 | $1,060 | $4,328 | $695 | |
| 1998 | $5,469 | $1,010 | $1,797 | $597 | $2,394 | $1,196 | $3,590 | $1,132 | $4,721 | $748 | |
| 1999 | $5,909 | $1,153 | $2,012 | $641 | $2,653 | $1,274 | $3,927 | $1,199 | $5,126 | $783 | |
| 2000 | $6,424 | $1,337 | $2,267 | $688 | $2,955 | $1,358 | $4,314 | $1,276 | $5,590 | $834 | |
| The IRS changed methodology, so data above and below this line are not strictly comparable. | |||||||||||
| 2001 | $6,116 | $492 | $1,065 | $1,934 | $666 | $2,600 | $1,334 | $3,933 | $1,302 | $5,235 | $881 |
| 2002 | $5,982 | $421 | $960 | $1,812 | $660 | $2,472 | $1,339 | $3,812 | $1,303 | $5,115 | $867 |
| 2003 | $6,157 | $466 | $1,030 | $1,908 | $679 | $2,587 | $1,375 | $3,962 | $1,325 | $5,287 | $870 |
| 2004 | $6,735 | $615 | $1,279 | $2,243 | $725 | $2,968 | $1,455 | $4,423 | $1,403 | $5,826 | $908 |
| 2005 | $7,366 | $784 | $1,561 | $2,623 | $778 | $3,401 | $1,540 | $4,940 | $1,473 | $6,413 | $953 |
| 2006 | $7,970 | $895 | $1,761 | $2,918 | $841 | $3,760 | $1,652 | $5,412 | $1,568 | $6,980 | $990 |
| 2007 | $8,622 | $1,030 | $1,971 | $3,223 | $905 | $4,128 | $1,770 | $5,898 | $1,673 | $7,571 | $1,051 |
| 2008 | $8,206 | $826 | $1,657 | $2,868 | $905 | $3,773 | $1,782 | $5,555 | $1,673 | $7,228 | $978 |
| 2009 | $7,579 | $602 | $1,305 | $2,439 | $878 | $3,317 | $1,740 | $5,058 | $1,620 | $6,678 | $900 |
| 2010 | $8,040 | $743 | $1,517 | $2,716 | $915 | $3,631 | $1,800 | $5,431 | $1,665 | $7,096 | $944 |
| 2011 | $8,317 | $737 | $1,556 | $2,819 | $956 | $3,775 | $1,866 | $5,641 | $1,716 | $7,357 | $961 |
| 2012 | $9,042 | $1,017 | $1,977 | $3,331 | $997 | $4,328 | $1,934 | $6,262 | $1,776 | $8,038 | $1,004 |
| 2013 | $9,034 | $816 | $1,720 | $3,109 | $1,034 | $4,143 | $2,008 | $6,152 | $1,844 | $7,996 | $1,038 |
| Source: Internal Revenue Service. | |||||||||||
| Table 4. Total Income Tax after Credits, 1980–2013 (in Billions of Dollars) | |||||||||||
| Year | Total | Top 0.1% | Top 1% | Top 5% | Between 5% & 10% | Top 10% | Between 10% & 25% | Top 25% | Between 25% & 50% | Top 50% | Bottom 50% |
| 1980 | $249 | $47 | $92 | $31 | $123 | $59 | $182 | $50 | $232 | $18 | |
| 1981 | $282 | $50 | $99 | $36 | $135 | $69 | $204 | $57 | $261 | $21 | |
| 1982 | $276 | $53 | $100 | $34 | $134 | $66 | $200 | $56 | $256 | $20 | |
| 1983 | $272 | $55 | $101 | $34 | $135 | $64 | $199 | $54 | $252 | $19 | |
| 1984 | $297 | $63 | $113 | $37 | $150 | $68 | $219 | $57 | $276 | $22 | |
| 1985 | $322 | $70 | $125 | $41 | $166 | $73 | $238 | $60 | $299 | $23 | |
| 1986 | $367 | $94 | $156 | $44 | $201 | $78 | $279 | $64 | $343 | $24 | |
| The Tax Reform Act of 1986 changed the definition of AGI, so data above and below this line are not strictly comparable. | |||||||||||
| 1987 | $369 | $92 | $160 | $46 | $205 | $79 | $284 | $63 | $347 | $22 | |
| 1988 | $413 | $114 | $188 | $48 | $236 | $85 | $321 | $68 | $389 | $24 | |
| 1989 | $433 | $109 | $190 | $51 | $241 | $93 | $334 | $73 | $408 | $25 | |
| 1990 | $447 | $112 | $195 | $52 | $248 | $97 | $344 | $77 | $421 | $26 | |
| 1991 | $448 | $111 | $194 | $56 | $250 | $96 | $347 | $77 | $424 | $25 | |
| 1992 | $476 | $131 | $218 | $58 | $276 | $97 | $374 | $78 | $452 | $24 | |
| 1993 | $503 | $146 | $238 | $60 | $298 | $101 | $399 | $80 | $479 | $24 | |
| 1994 | $535 | $154 | $254 | $64 | $318 | $108 | $425 | $84 | $509 | $25 | |
| 1995 | $588 | $178 | $288 | $70 | $357 | $115 | $473 | $88 | $561 | $27 | |
| 1996 | $658 | $213 | $335 | $76 | $411 | $124 | $535 | $95 | $630 | $28 | |
| 1997 | $727 | $241 | $377 | $82 | $460 | $134 | $594 | $102 | $696 | $31 | |
| 1998 | $788 | $274 | $425 | $88 | $513 | $139 | $652 | $103 | $755 | $33 | |
| 1999 | $877 | $317 | $486 | $97 | $583 | $150 | $733 | $109 | $842 | $35 | |
| 2000 | $981 | $367 | $554 | $106 | $660 | $164 | $824 | $118 | $942 | $38 | |
| The IRS changed methodology, so data above and below this line are not strictly comparable. | |||||||||||
| 2001 | $885 | $139 | $294 | $462 | $101 | $564 | $158 | $722 | $120 | $842 | $43 |
| 2002 | $794 | $120 | $263 | $420 | $93 | $513 | $143 | $657 | $104 | $761 | $33 |
| 2003 | $746 | $115 | $251 | $399 | $85 | $484 | $133 | $617 | $98 | $715 | $30 |
| 2004 | $829 | $142 | $301 | $467 | $91 | $558 | $137 | $695 | $102 | $797 | $32 |
| 2005 | $932 | $176 | $361 | $549 | $98 | $647 | $145 | $793 | $106 | $898 | $33 |
| 2006 | $1,020 | $196 | $402 | $607 | $108 | $715 | $157 | $872 | $113 | $986 | $35 |
| 2007 | $1,112 | $221 | $443 | $666 | $117 | $783 | $170 | $953 | $122 | $1,075 | $37 |
| 2008 | $1,029 | $187 | $386 | $597 | $115 | $712 | $168 | $880 | $117 | $997 | $32 |
| 2009 | $863 | $146 | $314 | $502 | $101 | $604 | $146 | $749 | $93 | $842 | $21 |
| 2010 | $949 | $170 | $355 | $561 | $110 | $670 | $156 | $827 | $100 | $927 | $22 |
| 2011 | $1,043 | $168 | $366 | $589 | $123 | $712 | $181 | $893 | $120 | $1,012 | $30 |
| 2012 | $1,185 | $220 | $451 | $699 | $133 | $831 | $193 | $1,024 | $128 | $1,152 | $33 |
| 2013 | $1,232 | $228 | $466 | $721 | $139 | $860 | $203 | $1,063 | $135 | $1,198 | $34 |
| Table 5. Adjusted Gross Income Shares, 1980–2013 (Percent of Total AGI Earned by Each Group) | |||||||||||
| Year | Total | Top 0.1% | Top 1% | Top 5% | Between 5% & 10% | Top 10% | Between 10% & 25% | Top 25% | Between 25% & 50% | Top 50% | Bottom 50% |
| 1980 | 100% | 8.46% | 21.01% | 11.12% | 32.13% | 24.57% | 56.70% | 25.62% | 82.32% | 17.68% | |
| 1981 | 100% | 8.30% | 20.78% | 11.20% | 31.98% | 24.69% | 56.67% | 25.59% | 82.25% | 17.75% | |
| 1982 | 100% | 8.91% | 21.23% | 11.03% | 32.26% | 24.53% | 56.79% | 25.50% | 82.29% | 17.71% | |
| 1983 | 100% | 9.29% | 21.74% | 11.04% | 32.78% | 24.44% | 57.22% | 25.30% | 82.52% | 17.48% | |
| 1984 | 100% | 9.66% | 22.19% | 11.06% | 33.25% | 24.31% | 57.56% | 25.00% | 82.56% | 17.44% | |
| 1985 | 100% | 10.03% | 22.67% | 11.10% | 33.77% | 24.21% | 57.97% | 24.77% | 82.74% | 17.26% | |
| 1986 | 100% | 11.30% | 24.11% | 11.02% | 35.12% | 23.92% | 59.04% | 24.30% | 83.34% | 16.66% | |
| The Tax Reform Act of 1986 changed the definition of AGI, so data above and below this line are not strictly comparable. | |||||||||||
| 1987 | 100% | 12.32% | 25.67% | 11.23% | 36.90% | 23.85% | 60.75% | 23.62% | 84.37% | 15.63% | |
| 1988 | 100% | 15.16% | 28.51% | 10.94% | 39.45% | 22.99% | 62.44% | 22.63% | 85.07% | 14.93% | |
| 1989 | 100% | 14.19% | 27.84% | 11.16% | 39.00% | 23.28% | 62.28% | 22.76% | 85.04% | 14.96% | |
| 1990 | 100% | 14.00% | 27.62% | 11.15% | 38.77% | 23.36% | 62.13% | 22.84% | 84.97% | 15.03% | |
| 1991 | 100% | 12.99% | 26.83% | 11.37% | 38.20% | 23.65% | 61.85% | 23.01% | 84.87% | 15.13% | |
| 1992 | 100% | 14.23% | 28.01% | 11.21% | 39.23% | 23.25% | 62.47% | 22.61% | 85.08% | 14.92% | |
| 1993 | 100% | 13.79% | 27.76% | 11.29% | 39.05% | 23.40% | 62.45% | 22.63% | 85.08% | 14.92% | |
| 1994 | 100% | 13.80% | 27.85% | 11.34% | 39.19% | 23.45% | 62.64% | 22.48% | 85.11% | 14.89% | |
| 1995 | 100% | 14.60% | 28.81% | 11.35% | 40.16% | 23.21% | 63.37% | 22.09% | 85.46% | 14.54% | |
| 1996 | 100% | 16.04% | 30.36% | 11.23% | 41.59% | 22.73% | 64.32% | 21.60% | 85.92% | 14.08% | |
| 1997 | 100% | 17.38% | 31.79% | 11.03% | 42.83% | 22.22% | 65.05% | 21.11% | 86.16% | 13.84% | |
| 1998 | 100% | 18.47% | 32.85% | 10.92% | 43.77% | 21.87% | 65.63% | 20.69% | 86.33% | 13.67% | |
| 1999 | 100% | 19.51% | 34.04% | 10.85% | 44.89% | 21.57% | 66.46% | 20.29% | 86.75% | 13.25% | |
| 2000 | 100% | 20.81% | 35.30% | 10.71% | 46.01% | 21.15% | 67.15% | 19.86% | 87.01% | 12.99% | |
| The IRS changed methodology, so data above and below this line are not strictly comparable. | |||||||||||
| 2001 | 100% | 8.05% | 17.41% | 31.61% | 10.89% | 42.50% | 21.80% | 64.31% | 21.29% | 85.60% | 14.40% |
| 2002 | 100% | 7.04% | 16.05% | 30.29% | 11.04% | 41.33% | 22.39% | 63.71% | 21.79% | 85.50% | 14.50% |
| 2003 | 100% | 7.56% | 16.73% | 30.99% | 11.03% | 42.01% | 22.33% | 64.34% | 21.52% | 85.87% | 14.13% |
| 2004 | 100% | 9.14% | 18.99% | 33.31% | 10.77% | 44.07% | 21.60% | 65.68% | 20.83% | 86.51% | 13.49% |
| 2005 | 100% | 10.64% | 21.19% | 35.61% | 10.56% | 46.17% | 20.90% | 67.07% | 19.99% | 87.06% | 12.94% |
| 2006 | 100% | 11.23% | 22.10% | 36.62% | 10.56% | 47.17% | 20.73% | 67.91% | 19.68% | 87.58% | 12.42% |
| 2007 | 100% | 11.95% | 22.86% | 37.39% | 10.49% | 47.88% | 20.53% | 68.41% | 19.40% | 87.81% | 12.19% |
| 2008 | 100% | 10.06% | 20.19% | 34.95% | 11.03% | 45.98% | 21.71% | 67.69% | 20.39% | 88.08% | 11.92% |
| 2009 | 100% | 7.94% | 17.21% | 32.18% | 11.59% | 43.77% | 22.96% | 66.74% | 21.38% | 88.12% | 11.88% |
| 2010 | 100% | 9.24% | 18.87% | 33.78% | 11.38% | 45.17% | 22.38% | 67.55% | 20.71% | 88.26% | 11.74% |
| 2011 | 100% | 8.86% | 18.70% | 33.89% | 11.50% | 45.39% | 22.43% | 67.82% | 20.63% | 88.45% | 11.55% |
| 2012 | 100% | 11.25% | 21.86% | 36.84% | 11.03% | 47.87% | 21.39% | 69.25% | 19.64% | 88.90% | 11.10% |
| 2013 | 100% | 9.03% | 19.04% | 34.42% | 11.45% | 45.87% | 22.23% | 68.10% | 20.41% | 88.51% | 11.49% |
| Source: Internal Revenue Service. | |||||||||||
| Table 6. Total Income Tax Shares, 1980–2013 (Percent of Federal Income Tax Paid by Each Group) | |||||||||||
| Year | Total | Top 0.1% | Top 1% | Top 5% | Between 5% & 10% | Top 10% | Between 10% & 25% | Top 25% | Between 25% & 50% | Top 50% | Bottom 50% |
| 1980 | 100% | 19.05% | 36.84% | 12.44% | 49.28% | 23.74% | 73.02% | 19.93% | 92.95% | 7.05% | |
| 1981 | 100% | 17.58% | 35.06% | 12.90% | 47.96% | 24.33% | 72.29% | 20.26% | 92.55% | 7.45% | |
| 1982 | 100% | 19.03% | 36.13% | 12.45% | 48.59% | 23.91% | 72.50% | 20.15% | 92.65% | 7.35% | |
| 1983 | 100% | 20.32% | 37.26% | 12.44% | 49.71% | 23.39% | 73.10% | 19.73% | 92.83% | 7.17% | |
| 1984 | 100% | 21.12% | 37.98% | 12.58% | 50.56% | 22.92% | 73.49% | 19.16% | 92.65% | 7.35% | |
| 1985 | 100% | 21.81% | 38.78% | 12.67% | 51.46% | 22.60% | 74.06% | 18.77% | 92.83% | 7.17% | |
| 1986 | 100% | 25.75% | 42.57% | 12.12% | 54.69% | 21.33% | 76.02% | 17.52% | 93.54% | 6.46% | |
| The Tax Reform Act of 1986 changed the definition of AGI, so data above and below this line are not strictly comparable. | |||||||||||
| 1987 | 100% | 24.81% | 43.26% | 12.35% | 55.61% | 21.31% | 76.92% | 17.02% | 93.93% | 6.07% | |
| 1988 | 100% | 27.58% | 45.62% | 11.66% | 57.28% | 20.57% | 77.84% | 16.44% | 94.28% | 5.72% | |
| 1989 | 100% | 25.24% | 43.94% | 11.85% | 55.78% | 21.44% | 77.22% | 16.94% | 94.17% | 5.83% | |
| 1990 | 100% | 25.13% | 43.64% | 11.73% | 55.36% | 21.66% | 77.02% | 17.16% | 94.19% | 5.81% | |
| 1991 | 100% | 24.82% | 43.38% | 12.45% | 55.82% | 21.46% | 77.29% | 17.23% | 94.52% | 5.48% | |
| 1992 | 100% | 27.54% | 45.88% | 12.12% | 58.01% | 20.47% | 78.48% | 16.46% | 94.94% | 5.06% | |
| 1993 | 100% | 29.01% | 47.36% | 11.88% | 59.24% | 20.03% | 79.27% | 15.92% | 95.19% | 4.81% | |
| 1994 | 100% | 28.86% | 47.52% | 11.93% | 59.45% | 20.10% | 79.55% | 15.68% | 95.23% | 4.77% | |
| 1995 | 100% | 30.26% | 48.91% | 11.84% | 60.75% | 19.62% | 80.36% | 15.03% | 95.39% | 4.61% | |
| 1996 | 100% | 32.31% | 50.97% | 11.54% | 62.51% | 18.80% | 81.32% | 14.36% | 95.68% | 4.32% | |
| 1997 | 100% | 33.17% | 51.87% | 11.33% | 63.20% | 18.47% | 81.67% | 14.05% | 95.72% | 4.28% | |
| 1998 | 100% | 34.75% | 53.84% | 11.20% | 65.04% | 17.65% | 82.69% | 13.10% | 95.79% | 4.21% | |
| 1999 | 100% | 36.18% | 55.45% | 11.00% | 66.45% | 17.09% | 83.54% | 12.46% | 96.00% | 4.00% | |
| 2000 | 100% | 37.42% | 56.47% | 10.86% | 67.33% | 16.68% | 84.01% | 12.08% | 96.09% | 3.91% | |
| The IRS changed methodology, so data above and below this line are not strictly comparable. | |||||||||||
| 2001 | 100% | 15.68% | 33.22% | 52.24% | 11.44% | 63.68% | 17.88% | 81.56% | 13.54% | 95.10% | 4.90% |
| 2002 | 100% | 15.09% | 33.09% | 52.86% | 11.77% | 64.63% | 18.04% | 82.67% | 13.12% | 95.79% | 4.21% |
| 2003 | 100% | 15.37% | 33.69% | 53.54% | 11.35% | 64.89% | 17.87% | 82.76% | 13.17% | 95.93% | 4.07% |
| 2004 | 100% | 17.12% | 36.28% | 56.35% | 10.96% | 67.30% | 16.52% | 83.82% | 12.31% | 96.13% | 3.87% |
| 2005 | 100% | 18.91% | 38.78% | 58.93% | 10.52% | 69.46% | 15.61% | 85.07% | 11.35% | 96.41% | 3.59% |
| 2006 | 100% | 19.24% | 39.36% | 59.49% | 10.59% | 70.08% | 15.41% | 85.49% | 11.10% | 96.59% | 3.41% |
| 2007 | 100% | 19.84% | 39.81% | 59.90% | 10.51% | 70.41% | 15.30% | 85.71% | 10.93% | 96.64% | 3.36% |
| 2008 | 100% | 18.20% | 37.51% | 58.06% | 11.14% | 69.20% | 16.37% | 85.57% | 11.33% | 96.90% | 3.10% |
| 2009 | 100% | 16.91% | 36.34% | 58.17% | 11.72% | 69.89% | 16.85% | 86.74% | 10.80% | 97.54% | 2.46% |
| 2010 | 100% | 17.88% | 37.38% | 59.07% | 11.55% | 70.62% | 16.49% | 87.11% | 10.53% | 97.64% | 2.36% |
| 2011 | 100% | 16.14% | 35.06% | 56.49% | 11.77% | 68.26% | 17.36% | 85.62% | 11.50% | 97.11% | 2.89% |
| 2012 | 100% | 18.60% | 38.09% | 58.95% | 11.22% | 70.17% | 16.25% | 86.42% | 10.80% | 97.22% | 2.78% |
| 2013 | 100% | 18.48% | 37.80% | 58.55% | 11.25% | 69.80% | 16.47% | 86.27% | 10.94% | 97.22% | 2.78% |
| Source: Internal Revenue Service. | |||||||||||
| Table 7. Dollar Cut-Off, 1980–2013 (Minimum AGI for Tax Returns to Fall into Various Percentiles; Thresholds Not Adjusted for Inflation) | ||||||
| Year | Top 0.1% | Top 1% | Top 5% | Top 10% | Top 25% | Top 50% |
| 1980 | $80,580 | $43,792 | $35,070 | $23,606 | $12,936 | |
| 1981 | $85,428 | $47,845 | $38,283 | $25,655 | $14,000 | |
| 1982 | $89,388 | $49,284 | $39,676 | $27,027 | $14,539 | |
| 1983 | $93,512 | $51,553 | $41,222 | $27,827 | $15,044 | |
| 1984 | $100,889 | $55,423 | $43,956 | $29,360 | $15,998 | |
| 1985 | $108,134 | $58,883 | $46,322 | $30,928 | $16,688 | |
| 1986 | $118,818 | $62,377 | $48,656 | $32,242 | $17,302 | |
| The Tax Reform Act of 1986 changed the definition of AGI, so data above and below this line are not strictly comparable. | ||||||
| 1987 | $139,289 | $68,414 | $52,921 | $33,983 | $17,768 | |
| 1988 | $157,136 | $72,735 | $55,437 | $35,398 | $18,367 | |
| 1989 | $163,869 | $76,933 | $58,263 | $36,839 | $18,993 | |
| 1990 | $167,421 | $79,064 | $60,287 | $38,080 | $19,767 | |
| 1991 | $170,139 | $81,720 | $61,944 | $38,929 | $20,097 | |
| 1992 | $181,904 | $85,103 | $64,457 | $40,378 | $20,803 | |
| 1993 | $185,715 | $87,386 | $66,077 | $41,210 | $21,179 | |
| 1994 | $195,726 | $91,226 | $68,753 | $42,742 | $21,802 | |
| 1995 | $209,406 | $96,221 | $72,094 | $44,207 | $22,344 | |
| 1996 | $227,546 | $101,141 | $74,986 | $45,757 | $23,174 | |
| 1997 | $250,736 | $108,048 | $79,212 | $48,173 | $24,393 | |
| 1998 | $269,496 | $114,729 | $83,220 | $50,607 | $25,491 | |
| 1999 | $293,415 | $120,846 | $87,682 | $52,965 | $26,415 | |
| 2000 | $313,469 | $128,336 | $92,144 | $55,225 | $27,682 | |
| The IRS changed methodology, so data above and below this line are not strictly comparable. | ||||||
| 2001 | $1,393,718 | $306,635 | $132,082 | $96,151 | $59,026 | $31,418 |
| 2002 | $1,245,352 | $296,194 | $130,750 | $95,699 | $59,066 | $31,299 |
| 2003 | $1,317,088 | $305,939 | $133,741 | $97,470 | $59,896 | $31,447 |
| 2004 | $1,617,918 | $339,993 | $140,758 | $101,838 | $62,794 | $32,622 |
| 2005 | $1,938,175 | $379,261 | $149,216 | $106,864 | $64,821 | $33,484 |
| 2006 | $2,124,625 | $402,603 | $157,390 | $112,016 | $67,291 | $34,417 |
| 2007 | $2,251,017 | $426,439 | $164,883 | $116,396 | $69,559 | $35,541 |
| 2008 | $1,867,652 | $392,513 | $163,512 | $116,813 | $69,813 | $35,340 |
| 2009 | $1,469,393 | $351,968 | $157,342 | $114,181 | $68,216 | $34,156 |
| 2010 | $1,634,386 | $369,691 | $161,579 | $116,623 | $69,126 | $34,338 |
| 2011 | $1,717,675 | $388,905 | $167,728 | $120,136 | $70,492 | $34,823 |
| 2012 | $2,161,175 | $434,682 | $175,817 | $125,195 | $73,354 | $36,055 |
| 2013 | $1,860,848 | $428,713 | $179,760 | $127,695 | $74,955 | $36,841 |
| Source: Internal Revenue Service. | ||||||
| Table 8. Average Tax Rate, 1980–2013 (Percent of AGI Paid in Income Taxes) | |||||||||||
| Year | Total | Top 0.1% | Top 1% | Top 5% | Between 5% & 10% | Top 10% | Between 10% & 25% | Top 25% | Between 25% & 50% | Top 50% | Bottom 50% |
| 1980 | 15.31% | 34.47% | 26.85% | 17.13% | 23.49% | 14.80% | 19.72% | 11.91% | 17.29% | 6.10% | |
| 1981 | 15.76% | 33.37% | 26.59% | 18.16% | 23.64% | 15.53% | 20.11% | 12.48% | 17.73% | 6.62% | |
| 1982 | 14.72% | 31.43% | 25.05% | 16.61% | 22.17% | 14.35% | 18.79% | 11.63% | 16.57% | 6.10% | |
| 1983 | 13.79% | 30.18% | 23.64% | 15.54% | 20.91% | 13.20% | 17.62% | 10.76% | 15.52% | 5.66% | |
| 1984 | 13.68% | 29.92% | 23.42% | 15.57% | 20.81% | 12.90% | 17.47% | 10.48% | 15.35% | 5.77% | |
| 1985 | 13.73% | 29.86% | 23.50% | 15.69% | 20.93% | 12.83% | 17.55% | 10.41% | 15.41% | 5.70% | |
| 1986 | 14.54% | 33.13% | 25.68% | 15.99% | 22.64% | 12.97% | 18.72% | 10.48% | 16.32% | 5.63% | |
| The Tax Reform Act of 1986 changed the definition of AGI, so data above and below this line are not strictly comparable. | |||||||||||
| 1987 | 13.12% | 26.41% | 22.10% | 14.43% | 19.77% | 11.71% | 16.61% | 9.45% | 14.60% | 5.09% | |
| 1988 | 13.21% | 24.04% | 21.14% | 14.07% | 19.18% | 11.82% | 16.47% | 9.60% | 14.64% | 5.06% | |
| 1989 | 13.12% | 23.34% | 20.71% | 13.93% | 18.77% | 12.08% | 16.27% | 9.77% | 14.53% | 5.11% | |
| 1990 | 12.95% | 23.25% | 20.46% | 13.63% | 18.50% | 12.01% | 16.06% | 9.73% | 14.36% | 5.01% | |
| 1991 | 12.75% | 24.37% | 20.62% | 13.96% | 18.63% | 11.57% | 15.93% | 9.55% | 14.20% | 4.62% | |
| 1992 | 12.94% | 25.05% | 21.19% | 13.99% | 19.13% | 11.39% | 16.25% | 9.42% | 14.44% | 4.39% | |
| 1993 | 13.32% | 28.01% | 22.71% | 14.01% | 20.20% | 11.40% | 16.90% | 9.37% | 14.90% | 4.29% | |
| 1994 | 13.50% | 28.23% | 23.04% | 14.20% | 20.48% | 11.57% | 17.15% | 9.42% | 15.11% | 4.32% | |
| 1995 | 13.86% | 28.73% | 23.53% | 14.46% | 20.97% | 11.71% | 17.58% | 9.43% | 15.47% | 4.39% | |
| 1996 | 14.34% | 28.87% | 24.07% | 14.74% | 21.55% | 11.86% | 18.12% | 9.53% | 15.96% | 4.40% | |
| 1997 | 14.48% | 27.64% | 23.62% | 14.87% | 21.36% | 12.04% | 18.18% | 9.63% | 16.09% | 4.48% | |
| 1998 | 14.42% | 27.12% | 23.63% | 14.79% | 21.42% | 11.63% | 18.16% | 9.12% | 16.00% | 4.44% | |
| 1999 | 14.85% | 27.53% | 24.18% | 15.06% | 21.98% | 11.76% | 18.66% | 9.12% | 16.43% | 4.48% | |
| 2000 | 15.26% | 27.45% | 24.42% | 15.48% | 22.34% | 12.04% | 19.09% | 9.28% | 16.86% | 4.60% | |
| The IRS changed methodology, so data above and below this line are not strictly comparable. | |||||||||||
| 2001 | 14.47% | 28.17% | 27.60% | 23.91% | 15.20% | 21.68% | 11.87% | 18.35% | 9.20% | 16.08% | 4.92% |
| 2002 | 13.28% | 28.48% | 27.37% | 23.17% | 14.15% | 20.76% | 10.70% | 17.23% | 8.00% | 14.87% | 3.86% |
| 2003 | 12.11% | 24.60% | 24.38% | 20.92% | 12.46% | 18.70% | 9.69% | 15.57% | 7.41% | 13.53% | 3.49% |
| 2004 | 12.31% | 23.06% | 23.52% | 20.83% | 12.53% | 18.80% | 9.41% | 15.71% | 7.27% | 13.68% | 3.53% |
| 2005 | 12.65% | 22.48% | 23.15% | 20.93% | 12.61% | 19.03% | 9.45% | 16.04% | 7.18% | 14.01% | 3.51% |
| 2006 | 12.80% | 21.94% | 22.80% | 20.80% | 12.84% | 19.02% | 9.52% | 16.12% | 7.22% | 14.12% | 3.51% |
| 2007 | 12.90% | 21.42% | 22.46% | 20.66% | 12.92% | 18.96% | 9.61% | 16.16% | 7.27% | 14.19% | 3.56% |
| 2008 | 12.54% | 22.67% | 23.29% | 20.83% | 12.66% | 18.87% | 9.45% | 15.85% | 6.97% | 13.79% | 3.26% |
| 2009 | 11.39% | 24.28% | 24.05% | 20.59% | 11.53% | 18.19% | 8.36% | 14.81% | 5.76% | 12.61% | 2.35% |
| 2010 | 11.81% | 22.84% | 23.39% | 20.64% | 11.98% | 18.46% | 8.70% | 15.22% | 6.01% | 13.06% | 2.37% |
| 2011 | 12.54% | 22.82% | 23.50% | 20.89% | 12.83% | 18.85% | 9.70% | 15.82% | 6.98% | 13.76% | 3.13% |
| 2012 | 13.11% | 21.67% | 22.83% | 20.97% | 13.33% | 19.21% | 9.96% | 16.35% | 7.21% | 14.33% | 3.28% |
| 2013 | 13.64% | 27.91% | 27.08% | 23.20% | 13.40% | 20.75% | 10.11% | 17.28% | 7.31% | 14.98% | 3.30% |
| Source: Internal Revenue Service. | |||||||||||
To access this data on GitHub, click here.
(1) For data prior to 2001, all tax returns that have a positive AGI are included, even those that do not have a positive income tax liability. For data from 2001 forward, returns with negative AGI are also included, but dependent returns are excluded.
(2) Income tax after credits (the measure of “income taxes paid” above) does not account for the refundable portion of EITC. If it were included, the tax share of the top income groups would be higher. The refundable portion is classified as a spending program by the Office of Management and Budget and therefore is not included by the IRS in these figures.
(3) The only tax analyzed here is the federal individual income tax, which is responsible for about 25 percent of the nation’s taxes paid (at all levels of government). Federal income taxes are much more progressive than payroll taxes, which are responsible for about 20 percent of all taxes paid (at all levels of government), and are more progressive than most state and local taxes.
(4) AGI is a fairly narrow income concept and does not include income items like government transfers (except for the portion of Social Security benefits that is taxed), the value of employer-provided health insurance, underreported or unreported income (most notably that of sole proprietors), income derived from municipal bond interest, net imputed rental income, and others.
(5) The unit of analysis here is that of the tax return. In the figures prior to 2001, some dependent returns are included. Under other units of analysis (like the Treasury Department’s Family Economic Unit), these returns would likely be paired with parents’ returns.
(6) These figures represent the legal incidence of the income tax. Most distributional tables (such as those from CBO, Tax Policy Center, Citizens for Tax Justice, the Treasury Department, and JCT) assume that the entire economic incidence of personal income taxes falls on the income earner.
[1] Individual Income Tax Rates and Tax Shares, Internal Revenue Service Statistics of Income, http://www.irs.gov/uac/SOI-Tax-Stats-Individual-Income-Tax-Rates-and-Tax-Shares.
[2] See Richard Rubin, Capital Gains Rose 60% in Year Before U.S. Tax Increase, Bloomberg, Mar. 2014, http://www.bloomberg.com/news/articles/2014-03-20/capital-gains-rose-60-in-year-before-u-s-tax-increase
[3] Scott Greenberg, Here’s How Much Taxes on the Rich Rose in 2013, Tax Foundation, Aug. 2015, http://taxfoundation.org/blog/here-s-how-much-taxes-rich-rose-2013
http://taxfoundation.org/article/summary-latest-federal-income-tax-data-2015-update
The Pronk Pops Show Podcasts Portfolio
Listen To Pronk Pops Podcast or Download Shows 751-757
Listen To Pronk Pops Podcast or Download Shows 745-750
Listen To Pronk Pops Podcast or Download Shows 738-744
Listen To Pronk Pops Podcast or Download Shows 732-737
Listen To Pronk Pops Podcast or Download Shows 727-731
Listen To Pronk Pops Podcast or Download Shows 720-726
Listen To Pronk Pops Podcast or Download Shows 713-719
Listen To Pronk Pops Podcast or Download Shows 705-712
Listen To Pronk Pops Podcast or Download Shows 695-704
Listen To Pronk Pops Podcast or Download Shows 685-694
Listen To Pronk Pops Podcast or Download Shows 675-684
Listen To Pronk Pops Podcast or Download Shows 668-674
Listen To Pronk Pops Podcast or Download Shows 660-667
Listen To Pronk Pops Podcast or Download Shows 651-659
Listen To Pronk Pops Podcast or Download Shows 644-650
Listen To Pronk Pops Podcast or Download Shows 637-643
Listen To Pronk Pops Podcast or Download Shows 629-636
Listen To Pronk Pops Podcast or Download Shows 617-628
Listen To Pronk Pops Podcast or Download Shows 608-616
Listen To Pronk Pops Podcast or Download Shows 599-607
Listen To Pronk Pops Podcast or Download Shows 590-598
Listen To Pronk Pops Podcast or Download Shows 585- 589
Listen To Pronk Pops Podcast or Download Shows 575-584
Listen To Pronk Pops Podcast or Download Shows 565-574
Listen To Pronk Pops Podcast or Download Shows 556-564
Listen To Pronk Pops Podcast or Download Shows 546-555
Listen To Pronk Pops Podcast or Download Shows 538-545
Listen To Pronk Pops Podcast or Download Shows 532-537
Listen To Pronk Pops Podcast or Download Shows 526-531
Listen To Pronk Pops Podcast or Download Shows 519-525
Listen To Pronk Pops Podcast or Download Shows 510-518
Listen To Pronk Pops Podcast or Download Shows 500-509
Listen To Pronk Pops Podcast or Download Shows 490-499
Listen To Pronk Pops Podcast or Download Shows 480-489
Listen To Pronk Pops Podcast or Download Shows 473-479
Listen To Pronk Pops Podcast or Download Shows 464-472
Listen To Pronk Pops Podcast or Download Shows 455-463
Listen To Pronk Pops Podcast or Download Shows 447-454
Listen To Pronk Pops Podcast or Download Shows 439-446
Listen To Pronk Pops Podcast or Download Shows 431-438
Listen To Pronk Pops Podcast or Download Shows 422-430
Listen To Pronk Pops Podcast or Download Shows 414-421
Listen To Pronk Pops Podcast or Download Shows 408-413
Listen To Pronk Pops Podcast or Download Shows 400-407
Listen To Pronk Pops Podcast or Download Shows 391-399
Listen To Pronk Pops Podcast or Download Shows 383-390
Listen To Pronk Pops Podcast or Download Shows 376-382
Listen To Pronk Pops Podcast or Download Shows 369-375
Listen To Pronk Pops Podcast or Download Shows 360-368
Listen To Pronk Pops Podcast or Download Shows 354-359
Listen To Pronk Pops Podcast or Download Shows 346-353
Listen To Pronk Pops Podcast or Download Shows 338-345
Listen To Pronk Pops Podcast or Download Shows 328-337
Listen To Pronk Pops Podcast or Download Shows 319-327
Listen To Pronk Pops Podcast or Download Shows 307-318
Listen To Pronk Pops Podcast or Download Shows 296-306
Listen To Pronk Pops Podcast or Download Shows 287-295
Listen To Pronk Pops Podcast or Download Shows 277-286
Listen To Pronk Pops Podcast or Download Shows 264-276
Listen To Pronk Pops Podcast or Download Shows 250-263
Listen To Pronk Pops Podcast or Download Shows 236-249
Listen To Pronk Pops Podcast or Download Shows 222-235
Listen To Pronk Pops Podcast or Download Shows 211-221
Listen To Pronk Pops Podcast or Download Shows 202-210
Listen To Pronk Pops Podcast or Download Shows 194-201
Listen To Pronk Pops Podcast or Download Shows 184-193
Listen To Pronk Pops Podcast or Download Shows 174-183
Listen To Pronk Pops Podcast or Download Shows 165-173
Listen To Pronk Pops Podcast or Download Shows 158-164
Listen To Pronk Pops Podcast or Download Shows151-157
Listen To Pronk Pops Podcast or Download Shows 143-150
Listen To Pronk Pops Podcast or Download Shows 135-142
Listen To Pronk Pops Podcast or Download Shows 131-134
Listen To Pronk Pops Podcast or Download Shows 124-130
Listen To Pronk Pops Podcast or Download Shows 121-123
Listen To Pronk Pops Podcast or Download Shows 118-120
Listen To Pronk Pops Podcast or Download Shows 113 -117
Listen To Pronk Pops Podcast or Download Show 112
Listen To Pronk Pops Podcast or Download Shows 108-111
Listen To Pronk Pops Podcast or Download Shows 106-108
Listen To Pronk Pops Podcast or Download Shows 104-105
Listen To Pronk Pops Podcast or Download Shows 101-103
Listen To Pronk Pops Podcast or Download Shows 98-100
Listen To Pronk Pops Podcast or Download Shows 94-97
Listen To Pronk Pops Podcast or Download Show 93
Listen To Pronk Pops Podcast or Download Show 92
Listen To Pronk Pops Podcast or Download Show 91
Listen To Pronk Pops Podcast or Download Shows 88-90
Listen To Pronk Pops Podcast or Download Shows 84-87
Listen To Pronk Pops Podcast or Download Shows 79-83
Listen To Pronk Pops Podcast or Download Shows 74-78
Listen To Pronk Pops Podcast or Download Shows 71-73
Listen To Pronk Pops Podcast or Download Shows 68-70
Listen To Pronk Pops Podcast or Download Shows 65-67
Listen To Pronk Pops Podcast or Download Shows 62-64
Listen To Pronk Pops Podcast or Download Shows 58-61
Listen To Pronk Pops Podcast or Download Shows 55-57
Listen To Pronk Pops Podcast or Download Shows 52-54
Listen To Pronk Pops Podcast or Download Shows 49-51
Listen To Pronk Pops Podcast or Download Shows 45-48
Listen To Pronk Pops Podcast or Download Shows 41-44
Listen To Pronk Pops Podcast or Download Shows 38-40
Listen To Pronk Pops Podcast or Download Shows 34-37
Listen To Pronk Pops Podcast or Download Shows 30-33
Listen To Pronk Pops Podcast or Download Shows 27-29
Listen To Pronk Pops Podcast or Download Shows 17-26
Listen To Pronk Pops Podcast or Download Shows 16-22
Listen To Pronk Pops Podcast or Download Shows 10-15
Listen To Pronk Pops Podcast or Download Shows 1-9

Leave a comment